1 報告の範囲
1.1 市場概要
1.2 対象期間
1.3 研究目的
1.4 市場調査手法
1.5 研究プロセスとデータソース
1.6 経済指標
1.7 対象通貨
1.8 市場推計の留意点
2 執行要約
2.1 世界市場の概要
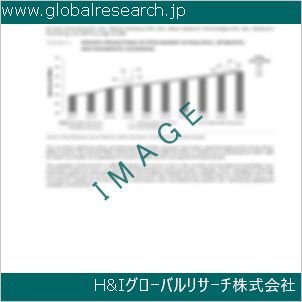
2.1.1 グローバルLNG再ガス化ターミナルの年間売上高(2020年~2031年)
2.1.2 地域別LNG再ガス化ターミナルの現状と将来分析(2020年、2024年、2031年)
2.1.3 世界におけるLNG再ガス化ターミナルの地域別(国/地域)現在の状況と将来予測(2020年、2024年、2031年)
2.2 LNG再ガス化ターミナルのセグメント別分析(タイプ別)
2.2.1 陸上型LNG再ガス化ターミナル
2.2.2 海上型LNG再ガス化ターミナル
2.3 LNG再ガス化ターミナルの売上高(タイプ別)
2.3.1 グローバルLNG再ガス化ターミナル販売市場シェア(タイプ別)(2020-2025)
2.3.2 グローバル LNG 再ガス化ターミナルの売上高と市場シェア(種類別)(2020-2025)
2.3.3 グローバルLNG再ガス化ターミナルの売上価格(種類別)(2020-2025)
2.4 LNG再ガス化ターミナルの用途別セグメント
2.4.1 民間利用
2.4.2 商業用
2.4.3 その他
2.5 LNG再ガス化ターミナルの用途別販売額
2.5.1 グローバル LNG 再ガス化ターミナル販売市場シェア(用途別)(2020-2025)
2.5.2 グローバルLNG再ガス化ターミナルの売上高と市場シェア(用途別)(2020-2025)
2.5.3 グローバル LNG 再ガス化ターミナル販売価格(用途別)(2020-2025)
3 グローバル企業別
3.1 グローバル LNG 再ガス化ターミナル 市場シェア企業別内訳
3.1.1 グローバル LNG再ガス化ターミナルの年間販売量(企業別)(2020-2025)
3.1.2 グローバルLNG再ガス化ターミナルの売上高市場シェア(企業別)(2020-2025)
3.2 グローバル LNG 再ガス化ターミナル 年間売上高(企業別)(2020-2025)
3.2.1 グローバル LNG 再ガス化ターミナルの企業別売上高(2020-2025)
3.2.2 グローバルLNG再ガス化ターミナル売上高市場シェア(企業別)(2020-2025)
3.3 グローバルLNG再ガス化ターミナル販売価格(企業別)
3.4 主要メーカー LNG再ガス化ターミナルの生産地域分布、販売地域、製品タイプ
3.4.1 主要メーカーのLNG再ガス化ターミナル製品立地分布
3.4.2 主要メーカーのLNG再ガス化ターミナル製品ラインナップ
3.5 市場集中率分析
3.5.1 競争環境分析
3.5.2 集中率(CR3、CR5、CR10)および(2023-2025)
3.6 新製品と潜在的な新規参入企業
3.7 市場M&A活動と戦略
4 地域別 LNG 再ガス化ターミナルの世界歴史的動向
4.1 世界地域別LNG再ガス化ターミナル市場規模(2020-2025)
4.1.1 地域別グローバルLNG再ガス化ターミナル年間売上高(2020-2025)
4.1.2 地域別グローバルLNG再ガス化ターミナル年間売上高(2020-2025)
4.2 世界LNG再ガス化ターミナル市場規模(地域別)(2020-2025)
4.2.1 グローバルLNG再ガス化ターミナルの年間売上高(国/地域別)(2020-2025)
4.2.2 グローバルLNG再ガス化ターミナルの年間売上高(地域別/国別)(2020-2025)
4.3 アメリカズ LNG再ガス化ターミナルの売上成長
4.4 アジア太平洋地域 LNG再ガス化ターミナルの売上高成長率
4.5 欧州 LNG再ガス化ターミナルの売上高成長率
4.6 中東・アフリカ LNG再ガス化ターミナルの売上高成長率
5 アメリカ
5.1 アメリカ大陸 LNG再ガス化ターミナルの売上高(国別)
5.1.1 アメリカ LNG再ガス化ターミナルの売上高(国別)(2020-2025)
5.1.2 アメリカ大陸 LNG再ガス化ターミナルの売上高(国別)(2020-2025)
5.2 アメリカ大陸 LNG再ガス化ターミナルの売上高(種類別)(2020-2025)
5.3 アメリカズ LNG再ガス化ターミナルの売上高(用途別)(2020-2025)
5.4 アメリカ合衆国
5.5 カナダ
5.6 メキシコ
5.7 ブラジル
6 アジア太平洋
6.1 APAC LNG再ガス化ターミナルの地域別販売額
6.1.1 APAC LNG再ガス化ターミナルの地域別販売額(2020-2025)
6.1.2 アジア太平洋地域(APAC)のLNG再ガス化ターミナルの売上高(地域別)(2020-2025)
6.2 アジア太平洋地域(APAC)のLNG再ガス化ターミナルの売上高(種類別)(2020-2025)
6.3 アジア太平洋地域(APAC)のLNG再ガス化ターミナルの売上高(用途別)(2020-2025)
6.4 中国
6.5 日本
6.6 韓国
6.7 東南アジア
6.8 インド
6.9 オーストラリア
6.10 中国・台湾
7 ヨーロッパ
7.1 欧州 LNG再ガス化ターミナル(国別)
7.1.1 欧州 LNG再ガス化ターミナルの売上高(国別)(2020-2025)
7.1.2 欧州 LNG再ガス化ターミナルの売上高(国別)(2020-2025)
7.2 欧州 LNG再ガス化ターミナルの売上高(種類別)(2020-2025)
7.3 欧州 LNG再ガス化ターミナルの売上高(用途別)(2020-2025)
7.4 ドイツ
7.5 フランス
7.6 イギリス
7.7 イタリア
7.8 ロシア
8 中東・アフリカ
8.1 中東・アフリカ LNG再ガス化ターミナル(国別)
8.1.1 中東・アフリカ LNG再ガス化ターミナルの売上高(国別)(2020-2025)
8.1.2 中東・アフリカ LNG再ガス化ターミナルの売上高(国別)(2020-2025)
8.2 中東・アフリカ LNG再ガス化ターミナルの売上高(種類別)(2020-2025)
8.3 中東・アフリカ LNG再ガス化ターミナルの売上高(用途別)(2020-2025)
8.4 エジプト
8.5 南アフリカ
8.6 イスラエル
8.7 トルコ
8.8 GCC諸国
9 市場動向、課題、およびトレンド
9.1 市場ドライバーと成長機会
9.2 市場課題とリスク
9.3 業界の動向
10 製造コスト構造分析
10.1 原材料とサプライヤー
10.2 LNG再ガス化ターミナルの製造コスト構造分析
10.3 LNG再ガス化ターミナルの製造プロセス分析
10.4 LNG再ガス化ターミナルの産業チェーン構造
11 マーケティング、販売代理店および顧客
11.1 販売チャネル
11.1.1 直接チャネル
11.1.2 間接チャネル
11.2 LNG再ガス化ターミナルの卸売業者
11.3 LNG再ガス化ターミナルの顧客
12 地域別LNG再ガス化ターミナルの世界市場予測レビュー
12.1 地域別グローバルLNG再ガス化ターミナル市場規模予測
12.1.1 地域別グローバルLNG再ガス化ターミナル予測(2026-2031)
12.1.2 地域別グローバルLNG再ガス化ターミナル年間売上高予測(2026-2031)
12.2 アメリカ地域別予測(2026-2031)
12.3 アジア太平洋地域別予測(2026-2031)
12.4 欧州地域別予測(2026-2031年)
12.5 中東・アフリカ地域別予測(2026-2031年)
12.6 グローバル LNG 再ガス化ターミナル タイプ別予測(2026-2031)
12.7 グローバルLNG再ガス化ターミナル市場予測(用途別)(2026-2031)
13 主要企業分析
13.1 SENER
13.1.1 SENER企業情報
13.1.2 SENER LNG再ガス化ターミナル製品ポートフォリオと仕様
13.1.3 SENER LNG再ガス化ターミナルの売上高、収益、価格、粗利益率(2020-2025)
13.1.4 SENER 主な事業概要
13.1.5 SENERの最新動向
13.2 Gas Natural Acu
13.2.1 Gas Natural Acu 会社概要
13.2.2 Gas Natural Acu LNG再ガス化ターミナル製品ポートフォリオと仕様
13.2.3 Gas Natural Acu LNG再ガス化ターミナルの売上高、収益、価格、粗利益率(2020-2025)
13.2.4 Gas Natural Acu 主な事業概要
13.2.5 ガス・ナチュラル・アキュの最新動向
13.3 ワルティラ
13.3.1 ワルティラ企業情報
13.3.2 ワルティラ LNG再ガス化ターミナル製品ポートフォリオと仕様
13.3.3 ワルツィラ LNG再ガス化ターミナルの売上高、収益、価格、および粗利益率(2020-2025)
13.3.4 ワルツィラ 主要事業概要
13.3.5 ワルティラの最新動向
13.4 ゴラル・マネジメント・リミテッド
13.4.1 Golar Management Ltd 会社概要
13.4.2 Golar Management Ltd LNG再ガス化ターミナル製品ポートフォリオと仕様
13.4.3 Golar Management Ltd LNG再ガス化ターミナルの売上高、収益、価格、および粗利益率(2020-2025)
13.4.4 ゴラル・マネジメント・リミテッド 主な事業概要
13.4.5 ゴラル・マネジメント・リミテッド 最新動向
13.5 KBR
13.5.1 KBR 会社情報
13.5.2 KBR LNG再ガス化ターミナル製品ポートフォリオと仕様
13.5.3 KBR LNG再ガス化ターミナルの売上高、収益、価格、および粗利益率(2020-2025)
13.5.4 KBR 主な事業概要
13.5.5 KBRの最新動向
13.6 HöeghLNG
13.6.1 HöeghLNG 会社概要
13.6.2 HöeghLNG LNG再ガス化ターミナル製品ポートフォリオと仕様
13.6.3 HöeghLNG LNG再ガス化ターミナルの売上高、収益、価格、および粗利益率(2020-2025)
13.6.4 HöeghLNG 主な事業概要
13.6.5 HöeghLNG 最新動向
13.7 JGCホールディングス株式会社
13.7.1 JGCホールディングス株式会社 会社概要
13.7.2 JGCホールディングス株式会社 LNG再ガス化ターミナル製品ポートフォリオと仕様
13.7.3 JGCホールディングス株式会社 LNG再ガス化ターミナルの売上高、収益、価格、および粗利益率(2020-2025)
13.7.4 JGCホールディングス株式会社 主な事業概要
13.7.5 JGCホールディングス株式会社の最新動向
13.8 チヨダ株式会社
13.8.1 チヨダ株式会社 会社概要
13.8.2 チヨダ株式会社 LNG再ガス化ターミナル製品ポートフォリオと仕様
13.8.3 チヨダ株式会社 LNG再ガス化ターミナルの売上高、収益、価格、および粗利益率(2020-2025)
13.8.4 千代田株式会社 主な事業概要
13.8.5 チヨダ株式会社の最新動向
13.9 ベクテル・コーポレーション
13.9.1 ベクテル・コーポレーション 会社概要
13.9.2 ベクテル・コーポレーション LNG再ガス化ターミナル製品ポートフォリオと仕様
13.9.3 ベクテル株式会社 LNG再ガス化ターミナルの売上高、収益、価格、粗利益率(2020-2025)
13.9.4 ベクテル・コーポレーション 主な事業概要
13.9.5 ベクテル・コーポレーションの最新動向
13.10 フルーア・コーポレーション
13.10.1 フルーア・コーポレーション 会社概要
13.10.2 フルーア・コーポレーション LNG再ガス化ターミナル製品ポートフォリオと仕様
13.10.3 フルーア・コーポレーション LNG再ガス化ターミナルの売上高、収益、価格、および粗利益率(2020-2025)
13.10.4 フルーア・コーポレーション 主な事業概要
13.10.5 フルーア・コーポレーションの最新動向
13.11 マクダーモット・インターナショナル・インク
13.11.1 マクダーモット・インターナショナル・インク 会社概要
13.11.2 マクダーモット・インターナショナル・インク LNG再ガス化ターミナル製品ポートフォリオと仕様
13.11.3 マクダーモット・インターナショナル・インク LNG再ガス化ターミナルの売上高、収益、価格、粗利益率(2020-2025)
13.11.4 マクダーモット・インターナショナル・インク 主な事業概要
13.11.5 マクダーモット・インターナショナル・インク 最新動向
13.12 Saipem SpA
13.12.1 Saipem SpA 会社概要
13.12.2 Saipem SpA LNG再ガス化ターミナル製品ポートフォリオと仕様
13.12.3 Saipem SpA LNG再ガス化ターミナルの売上高、収益、価格、粗利益率(2020-2025)
13.12.4 Saipem SpA 主な事業概要
13.12.5 Saipem SpA 最新動向
13.13 ジョン・ウッド・グループ PLC
13.13.1 ジョン・ウッド・グループ PLC 会社概要
13.13.2 ジョン・ウッド・グループ PLC LNG再ガス化ターミナル製品ポートフォリオと仕様
13.13.3 ジョン・ウッド・グループ PLC LNG再ガス化ターミナルの売上高、収益、価格、および粗利益率(2020-2025)
13.13.4 ジョン・ウッド・グループ PLC 主な事業概要
13.13.5 ジョン・ウッド・グループ PLC 最新動向
13.14 ヴィンチ・コンストラクション
13.14.1 ヴィンチ・コンストラクション会社情報
13.14.2 ヴィンチ・コンストラクション LNG再ガス化ターミナル製品ポートフォリオと仕様
13.14.3 ヴィンチ・コンストラクション LNG再ガス化ターミナルの売上高、収益、価格、粗利益率(2020-2025)
13.14.4 ヴィンチ・コンストラクション 主な事業概要
13.14.5 ヴィンチ・コンストラクションの最新動向
13.15 ロイヤル・ハスコニング・DHV
13.15.1 ロイヤル・ハスコニング・DHV 会社概要
13.15.2 ロイヤル・ハスコニング・DHV LNG再ガス化ターミナル製品ポートフォリオと仕様
13.15.3 ロイヤル・ハスコニング・DHV LNG再ガス化ターミナルの売上高、収益、価格、粗利益率(2020-2025)
13.15.4 ロイヤル・ハスコニング・DHV 主な事業概要
13.15.5 ロイヤル・ハスコニング・DHV 最新動向
13.16 テクニップ・FMC PLC
13.16.1 テクニップ・FMC プラシッド 会社概要
13.16.2 テクニップ・FMC plc LNG再ガス化ターミナル製品ポートフォリオと仕様
13.16.3 テクニップ・FMC・プラシッド LNG再ガス化ターミナルの売上高、収益、価格、粗利益率(2020-2025)
13.16.4 テクニップ・FMC プラシッド 主要事業概要
13.16.5 テクニップ・FMC プラシッド 最新動向
14 研究結果と結論
14.16.4 Technip FMC plc LNG再ガス化ターミナル製品ポートフォリオと仕様
1 Scope of the Report
1.1 Market Introduction
1.2 Years Considered
1.3 Research Objectives
1.4 Market Research Methodology
1.5 Research Process and Data Source
1.6 Economic Indicators
1.7 Currency Considered
1.8 Market Estimation Caveats
2 Executive Summary
2.1 World Market Overview
2.1.1 Global LNG Regasification Terminals Annual Sales 2020-2031
2.1.2 World Current & Future Analysis for LNG Regasification Terminals by Geographic Region, 2020, 2024 & 2031
2.1.3 World Current & Future Analysis for LNG Regasification Terminals by Country/Region, 2020, 2024 & 2031
2.2 LNG Regasification Terminals Segment by Type
2.2.1 Onshore LNG Regasification Terminals
2.2.2 Offshore LNG Regasification Terminals
2.3 LNG Regasification Terminals Sales by Type
2.3.1 Global LNG Regasification Terminals Sales Market Share by Type (2020-2025)
2.3.2 Global LNG Regasification Terminals Revenue and Market Share by Type (2020-2025)
2.3.3 Global LNG Regasification Terminals Sale Price by Type (2020-2025)
2.4 LNG Regasification Terminals Segment by Application
2.4.1 Private Use
2.4.2 Commercial
2.4.3 Others
2.5 LNG Regasification Terminals Sales by Application
2.5.1 Global LNG Regasification Terminals Sale Market Share by Application (2020-2025)
2.5.2 Global LNG Regasification Terminals Revenue and Market Share by Application (2020-2025)
2.5.3 Global LNG Regasification Terminals Sale Price by Application (2020-2025)
3 Global by Company
3.1 Global LNG Regasification Terminals Breakdown Data by Company
3.1.1 Global LNG Regasification Terminals Annual Sales by Company (2020-2025)
3.1.2 Global LNG Regasification Terminals Sales Market Share by Company (2020-2025)
3.2 Global LNG Regasification Terminals Annual Revenue by Company (2020-2025)
3.2.1 Global LNG Regasification Terminals Revenue by Company (2020-2025)
3.2.2 Global LNG Regasification Terminals Revenue Market Share by Company (2020-2025)
3.3 Global LNG Regasification Terminals Sale Price by Company
3.4 Key Manufacturers LNG Regasification Terminals Producing Area Distribution, Sales Area, Product Type
3.4.1 Key Manufacturers LNG Regasification Terminals Product Location Distribution
3.4.2 Players LNG Regasification Terminals Products Offered
3.5 Market Concentration Rate Analysis
3.5.1 Competition Landscape Analysis
3.5.2 Concentration Ratio (CR3, CR5 and CR10) & (2023-2025)
3.6 New Products and Potential Entrants
3.7 Market M&A Activity & Strategy
4 World Historic Review for LNG Regasification Terminals by Geographic Region
4.1 World Historic LNG Regasification Terminals Market Size by Geographic Region (2020-2025)
4.1.1 Global LNG Regasification Terminals Annual Sales by Geographic Region (2020-2025)
4.1.2 Global LNG Regasification Terminals Annual Revenue by Geographic Region (2020-2025)
4.2 World Historic LNG Regasification Terminals Market Size by Country/Region (2020-2025)
4.2.1 Global LNG Regasification Terminals Annual Sales by Country/Region (2020-2025)
4.2.2 Global LNG Regasification Terminals Annual Revenue by Country/Region (2020-2025)
4.3 Americas LNG Regasification Terminals Sales Growth
4.4 APAC LNG Regasification Terminals Sales Growth
4.5 Europe LNG Regasification Terminals Sales Growth
4.6 Middle East & Africa LNG Regasification Terminals Sales Growth
5 Americas
5.1 Americas LNG Regasification Terminals Sales by Country
5.1.1 Americas LNG Regasification Terminals Sales by Country (2020-2025)
5.1.2 Americas LNG Regasification Terminals Revenue by Country (2020-2025)
5.2 Americas LNG Regasification Terminals Sales by Type (2020-2025)
5.3 Americas LNG Regasification Terminals Sales by Application (2020-2025)
5.4 United States
5.5 Canada
5.6 Mexico
5.7 Brazil
6 APAC
6.1 APAC LNG Regasification Terminals Sales by Region
6.1.1 APAC LNG Regasification Terminals Sales by Region (2020-2025)
6.1.2 APAC LNG Regasification Terminals Revenue by Region (2020-2025)
6.2 APAC LNG Regasification Terminals Sales by Type (2020-2025)
6.3 APAC LNG Regasification Terminals Sales by Application (2020-2025)
6.4 China
6.5 Japan
6.6 South Korea
6.7 Southeast Asia
6.8 India
6.9 Australia
6.10 China Taiwan
7 Europe
7.1 Europe LNG Regasification Terminals by Country
7.1.1 Europe LNG Regasification Terminals Sales by Country (2020-2025)
7.1.2 Europe LNG Regasification Terminals Revenue by Country (2020-2025)
7.2 Europe LNG Regasification Terminals Sales by Type (2020-2025)
7.3 Europe LNG Regasification Terminals Sales by Application (2020-2025)
7.4 Germany
7.5 France
7.6 UK
7.7 Italy
7.8 Russia
8 Middle East & Africa
8.1 Middle East & Africa LNG Regasification Terminals by Country
8.1.1 Middle East & Africa LNG Regasification Terminals Sales by Country (2020-2025)
8.1.2 Middle East & Africa LNG Regasification Terminals Revenue by Country (2020-2025)
8.2 Middle East & Africa LNG Regasification Terminals Sales by Type (2020-2025)
8.3 Middle East & Africa LNG Regasification Terminals Sales by Application (2020-2025)
8.4 Egypt
8.5 South Africa
8.6 Israel
8.7 Turkey
8.8 GCC Countries
9 Market Drivers, Challenges and Trends
9.1 Market Drivers & Growth Opportunities
9.2 Market Challenges & Risks
9.3 Industry Trends
10 Manufacturing Cost Structure Analysis
10.1 Raw Material and Suppliers
10.2 Manufacturing Cost Structure Analysis of LNG Regasification Terminals
10.3 Manufacturing Process Analysis of LNG Regasification Terminals
10.4 Industry Chain Structure of LNG Regasification Terminals
11 Marketing, Distributors and Customer
11.1 Sales Channel
11.1.1 Direct Channels
11.1.2 Indirect Channels
11.2 LNG Regasification Terminals Distributors
11.3 LNG Regasification Terminals Customer
12 World Forecast Review for LNG Regasification Terminals by Geographic Region
12.1 Global LNG Regasification Terminals Market Size Forecast by Region
12.1.1 Global LNG Regasification Terminals Forecast by Region (2026-2031)
12.1.2 Global LNG Regasification Terminals Annual Revenue Forecast by Region (2026-2031)
12.2 Americas Forecast by Country (2026-2031)
12.3 APAC Forecast by Region (2026-2031)
12.4 Europe Forecast by Country (2026-2031)
12.5 Middle East & Africa Forecast by Country (2026-2031)
12.6 Global LNG Regasification Terminals Forecast by Type (2026-2031)
12.7 Global LNG Regasification Terminals Forecast by Application (2026-2031)
13 Key Players Analysis
13.1 SENER
13.1.1 SENER Company Information
13.1.2 SENER LNG Regasification Terminals Product Portfolios and Specifications
13.1.3 SENER LNG Regasification Terminals Sales, Revenue, Price and Gross Margin (2020-2025)
13.1.4 SENER Main Business Overview
13.1.5 SENER Latest Developments
13.2 Gas Natural Acu
13.2.1 Gas Natural Acu Company Information
13.2.2 Gas Natural Acu LNG Regasification Terminals Product Portfolios and Specifications
13.2.3 Gas Natural Acu LNG Regasification Terminals Sales, Revenue, Price and Gross Margin (2020-2025)
13.2.4 Gas Natural Acu Main Business Overview
13.2.5 Gas Natural Acu Latest Developments
13.3 Wärtsilä
13.3.1 Wärtsilä Company Information
13.3.2 Wärtsilä LNG Regasification Terminals Product Portfolios and Specifications
13.3.3 Wärtsilä LNG Regasification Terminals Sales, Revenue, Price and Gross Margin (2020-2025)
13.3.4 Wärtsilä Main Business Overview
13.3.5 Wärtsilä Latest Developments
13.4 Golar Management Ltd
13.4.1 Golar Management Ltd Company Information
13.4.2 Golar Management Ltd LNG Regasification Terminals Product Portfolios and Specifications
13.4.3 Golar Management Ltd LNG Regasification Terminals Sales, Revenue, Price and Gross Margin (2020-2025)
13.4.4 Golar Management Ltd Main Business Overview
13.4.5 Golar Management Ltd Latest Developments
13.5 KBR
13.5.1 KBR Company Information
13.5.2 KBR LNG Regasification Terminals Product Portfolios and Specifications
13.5.3 KBR LNG Regasification Terminals Sales, Revenue, Price and Gross Margin (2020-2025)
13.5.4 KBR Main Business Overview
13.5.5 KBR Latest Developments
13.6 HöeghLNG
13.6.1 HöeghLNG Company Information
13.6.2 HöeghLNG LNG Regasification Terminals Product Portfolios and Specifications
13.6.3 HöeghLNG LNG Regasification Terminals Sales, Revenue, Price and Gross Margin (2020-2025)
13.6.4 HöeghLNG Main Business Overview
13.6.5 HöeghLNG Latest Developments
13.7 JGC Holdings Corporation
13.7.1 JGC Holdings Corporation Company Information
13.7.2 JGC Holdings Corporation LNG Regasification Terminals Product Portfolios and Specifications
13.7.3 JGC Holdings Corporation LNG Regasification Terminals Sales, Revenue, Price and Gross Margin (2020-2025)
13.7.4 JGC Holdings Corporation Main Business Overview
13.7.5 JGC Holdings Corporation Latest Developments
13.8 Chiyoda Corporation
13.8.1 Chiyoda Corporation Company Information
13.8.2 Chiyoda Corporation LNG Regasification Terminals Product Portfolios and Specifications
13.8.3 Chiyoda Corporation LNG Regasification Terminals Sales, Revenue, Price and Gross Margin (2020-2025)
13.8.4 Chiyoda Corporation Main Business Overview
13.8.5 Chiyoda Corporation Latest Developments
13.9 Bechtel Corporation
13.9.1 Bechtel Corporation Company Information
13.9.2 Bechtel Corporation LNG Regasification Terminals Product Portfolios and Specifications
13.9.3 Bechtel Corporation LNG Regasification Terminals Sales, Revenue, Price and Gross Margin (2020-2025)
13.9.4 Bechtel Corporation Main Business Overview
13.9.5 Bechtel Corporation Latest Developments
13.10 Fluor Corporation
13.10.1 Fluor Corporation Company Information
13.10.2 Fluor Corporation LNG Regasification Terminals Product Portfolios and Specifications
13.10.3 Fluor Corporation LNG Regasification Terminals Sales, Revenue, Price and Gross Margin (2020-2025)
13.10.4 Fluor Corporation Main Business Overview
13.10.5 Fluor Corporation Latest Developments
13.11 McDermott International, Inc
13.11.1 McDermott International, Inc Company Information
13.11.2 McDermott International, Inc LNG Regasification Terminals Product Portfolios and Specifications
13.11.3 McDermott International, Inc LNG Regasification Terminals Sales, Revenue, Price and Gross Margin (2020-2025)
13.11.4 McDermott International, Inc Main Business Overview
13.11.5 McDermott International, Inc Latest Developments
13.12 Saipem SpA
13.12.1 Saipem SpA Company Information
13.12.2 Saipem SpA LNG Regasification Terminals Product Portfolios and Specifications
13.12.3 Saipem SpA LNG Regasification Terminals Sales, Revenue, Price and Gross Margin (2020-2025)
13.12.4 Saipem SpA Main Business Overview
13.12.5 Saipem SpA Latest Developments
13.13 John Wood Group PLC
13.13.1 John Wood Group PLC Company Information
13.13.2 John Wood Group PLC LNG Regasification Terminals Product Portfolios and Specifications
13.13.3 John Wood Group PLC LNG Regasification Terminals Sales, Revenue, Price and Gross Margin (2020-2025)
13.13.4 John Wood Group PLC Main Business Overview
13.13.5 John Wood Group PLC Latest Developments
13.14 Vinci Construction
13.14.1 Vinci Construction Company Information
13.14.2 Vinci Construction LNG Regasification Terminals Product Portfolios and Specifications
13.14.3 Vinci Construction LNG Regasification Terminals Sales, Revenue, Price and Gross Margin (2020-2025)
13.14.4 Vinci Construction Main Business Overview
13.14.5 Vinci Construction Latest Developments
13.15 Royal Haskoning DHV
13.15.1 Royal Haskoning DHV Company Information
13.15.2 Royal Haskoning DHV LNG Regasification Terminals Product Portfolios and Specifications
13.15.3 Royal Haskoning DHV LNG Regasification Terminals Sales, Revenue, Price and Gross Margin (2020-2025)
13.15.4 Royal Haskoning DHV Main Business Overview
13.15.5 Royal Haskoning DHV Latest Developments
13.16 Technip FMC plc
13.16.1 Technip FMC plc Company Information
13.16.2 Technip FMC plc LNG Regasification Terminals Product Portfolios and Specifications
13.16.3 Technip FMC plc LNG Regasification Terminals Sales, Revenue, Price and Gross Margin (2020-2025)
13.16.4 Technip FMC plc Main Business Overview
13.16.5 Technip FMC plc Latest Developments
14 Research Findings and Conclusion
| ※参考情報 LNG再ガス化基地は、液化天然ガス(LNG)を再び気体状に戻すための施設であり、エネルギー供給の多様化および効率化を目的としています。近年、エネルギーの安定供給が求められる中で、LNGはそのクリーンな燃焼特性や供給の柔軟性から、世界中で注目されるエネルギー資源として広がりを見せています。 まず、LNG再ガス化基地の定義について説明します。LNGは、天然ガスを-162℃まで冷却することによって液体化され、小さな体積で運搬可能となります。このLNGを基地において受け取り、再び気体状に戻すプロセスを行うのが、再ガス化基地の役割です。基本的に、LNG再ガス化基地はLNGを輸入する港や陸上に設置されることが多く、貯蔵タンク、再ガス化設備、加熱器、そして配管システムから構成されます。 再ガス化基地の特徴としては、まずその多様性が挙げられます。再ガス化基地は、規模や技術により多種多様なタイプが存在します。基本的には、ジョイントベンチャーや独立系の運営企業によって運営され、国内や国際的な需要に応じて柔軟に対応できる能力を備えています。また、再ガス化設備は、エネルギー生産において需要が高まる冬季などのピーク時に迅速な供給が求められるため、高速な再ガス化能力を持つことが重要です。 一方、LNG再ガス化基地にはいくつかの種類があります。一つは、岸壁式(バース)ターミナルです。このタイプは、LNG積載船が直接岸に接岸し、タンクにLNGを供給する形式で運用されます。岸壁式ターミナルは通常、大規模な港に設置され、大量のLNGを取り扱うことが可能です。もう一つは、浮体式再ガス化基地(FSRU)です。これは、定置された大型の船舶がLNGを再ガス化し、パイプラインを通じて陸上に送る方式で、コストや設置の柔軟性が大きなメリットです。 用途については、LNG再ガス化基地は主に都市ガス供給や発電用途に使われます。都市ガス供給においては、再ガス化された天然ガスが家庭や商業施設、工場などに供給され、暖房や調理、産業プロセスなどに利用されます。また、発電用途では、発電所に供給されることで、クリーンな電力の生成が可能となります。加えて、再ガス化基地は、非常事態や供給の途絶えた場合のバックアップシステムとしても機能するため、エネルギーの安定供給の観点から非常に重要です。 関連する技術としては、再ガス化プロセスに使用される熱交換器や加熱装置が重要です。これらの装置は、LNGを気化させるために必要な熱を提供します。また、流体力学的な設計も重要で、適切な圧力や流れを維持するために、パイプラインシステムの設計や制御技術が必要です。さらに、環境への配慮も重要です。特に、LNGの運搬や貯蔵、再ガス化プロセスにおけるメタンの漏洩を防ぐための技術や、安全管理の体制が求められています。 国際的な動向としては、再ガス化基地の建設は急増しており、特にアジア地域では需要が高まっています。中国やインドは、クリーンエネルギー源の一環としてLNGの導入を進めており、新たな再ガス化基地の建設が進行中です。また、これは従来の化石燃料に対する依存度を減少させ、温室効果ガスの排出削減にも寄与する可能性があります。同時に、再ガス化基地は国際的なエネルギー市場の動きにも影響を与え、輸入国のエネルギー安全保障を向上させる重要な役割を果たしています。 最後に、LNG再ガス化基地は私たちのエネルギーインフラの一部として、今後ますます重要性を増すと考えられます。技術の進歩や市場の需要に応じて、施設の設計や運営方式は変化し続けるでしょう。また、持続可能なエネルギーシステムの構築に向けた取り組みも不可欠であり、その過程でLNGの役割も進化し続けることでしょう。エネルギーの安定供給を実現するために、再ガス化基地はますます重要な要素となることが期待されます。 |
❖ 免責事項 ❖
http://www.globalresearch.jp/disclaimer