1 報告の範囲
1.1 市場概要
1.2 対象期間
1.3 研究目的
1.4 市場調査手法
1.5 研究プロセスとデータソース
1.6 経済指標
1.7 対象通貨
1.8 市場推計の留意点
2 執行要約
2.1 世界市場の概要
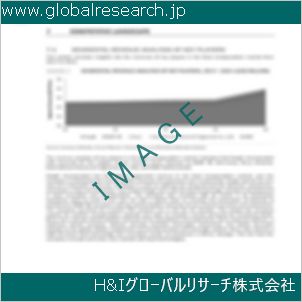
2.1.1 2020年から2031年までの小児用循環補助装置のグローバル年間売上高
2.1.2 地域別小児用循環支援製品の現在の状況と将来予測(2020年、2024年、2031年)
2.1.3 2020年、2024年、2031年の国/地域別小児用循環支援製品の現状と将来分析
2.2 小児用循環補助装置のセグメント別分析(タイプ別)
2.2.1 小児用カニューレ
2.2.2 小児用遠心式血液ポンプ
2.2.3 小児用動脈フィルター
2.2.4 血液濃縮装置
2.2.5 HMS Plus 止血管理システム
2.2.6 小児用酸素化装置
2.3 小児用循環支援装置の売上高(種類別)
2.3.1 グローバル小児用循環支援製品市場シェア(種類別)(2020-2025)
2.3.2 グローバル小児用循環支援製品売上高と市場シェア(種類別)(2020-2025)
2.3.3 グローバル小児用循環支援製品の販売価格(種類別)(2020-2025)
2.4 小児用循環補助装置の用途別セグメント
2.4.1 病院
2.4.2 クリニック
2.4.3 その他
2.5 小児用循環補助装置の売上高(用途別)
2.5.1 グローバル小児用循環支援製品市場シェア(用途別)(2020-2025)
2.5.2 グローバル小児用循環補助装置の売上高と市場シェア(用途別)(2020-2025)
2.5.3 グローバル小児用循環補助装置の売上価格(用途別)(2020-2025)
3 グローバル企業別
3.1 グローバル小児用循環補助装置製品市場における企業別内訳データ
3.1.1 グローバル小児用灌流製品年間売上高(企業別)(2020-2025)
3.1.2 グローバル小児用循環補助装置製品の販売市場シェア(企業別)(2020-2025)
3.2 グローバル小児用循環支援製品の年間売上高(企業別)(2020-2025)
3.2.1 グローバル小児用循環支援製品企業別売上高(2020-2025)
3.2.2 グローバル小児用循環支援製品売上高市場シェア(企業別)(2020-2025)
3.3 グローバル小児用循環支援製品の販売価格(企業別)
3.4 主要メーカーの小児用循環支援製品製造地域分布、販売地域、製品タイプ
3.4.1 主要メーカーの小児用循環支援製品 製品製造拠点分布
3.4.2 主要メーカーの小児用循環補助装置製品ラインナップ
3.5 市場集中率分析
3.5.1 競争環境分析
3.5.2 集中率(CR3、CR5、CR10)および(2023-2025)
3.6 新製品と潜在的な新規参入企業
3.7 市場M&A活動と戦略
4 世界小児用循環補助装置市場の歴史的動向(地域別)
4.1 世界小児用循環支援製品市場規模(地域別)(2020-2025)
4.1.1 地域別小児用灌流製品の世界年間売上高(2020-2025)
4.1.2 地域別小児用循環支援製品年間売上高(2020-2025)
4.2 世界小児用循環補助装置市場規模(地域別)(2020-2025)
4.2.1 世界小児循環支援製品市場規模(国/地域別年間売上高)(2020-2025)
4.2.2 世界小児用循環支援製品の年間売上高(地域別)(2020-2025)
4.3 アメリカズ小児用循環支援製品の販売成長率
4.4 アジア太平洋地域 小児用循環補助装置製品の販売成長
4.5 欧州小児循環支援製品の販売成長
4.6 中東・アフリカ地域 小児用循環補助装置の売上高成長率
5 アメリカ
5.1 アメリカズ小児用循環補助装置の売上高(国別)
5.1.1 アメリカズ小児用循環支援製品の販売額(国別)(2020-2025)
5.1.2 アメリカズ小児用循環支援製品の売上高(国別)(2020-2025)
5.2 アメリカズ小児用循環補助装置の売上高(種類別)(2020-2025)
5.3 アメリカズ小児用循環補助装置の売上高(用途別)(2020-2025)
5.4 アメリカ合衆国
5.5 カナダ
5.6 メキシコ
5.7 ブラジル
6 アジア太平洋地域
6.1 APAC地域別小児用循環補助装置販売額
6.1.1 APAC地域別小児用循環支援製品販売額(2020-2025)
6.1.2 アジア太平洋地域(APAC)の小児用循環補助装置の売上高(地域別)(2020-2025)
6.2 アジア太平洋地域(APAC)の小児用循環支援製品の販売額(2020-2025)
6.3 アジア太平洋地域(APAC)の小児用循環補助装置の売上高(用途別)(2020-2025)
6.4 中国
6.5 日本
6.6 韓国
6.7 東南アジア
6.8 インド
6.9 オーストラリア
6.10 中国・台湾
7 ヨーロッパ
7.1 ヨーロッパの小児用循環補助装置製品(国別)
7.1.1 欧州の小児用循環補助装置の売上高(国別)(2020-2025)
7.1.2 欧州の小児用循環支援製品の売上高(国別)(2020-2025)
7.2 欧州の小児用循環補助装置の売上高(種類別)(2020-2025)
7.3 欧州小児用循環支援装置の売上高(用途別)(2020-2025)
7.4 ドイツ
7.5 フランス
7.6 イギリス
7.7 イタリア
7.8 ロシア
8 中東・アフリカ
8.1 中東・アフリカ地域 小児用循環補助装置製品(国別)
8.1.1 中東・アフリカ地域 小児用循環補助製品の販売額(国別)(2020-2025)
8.1.2 中東・アフリカ地域 小児用循環補助装置の売上高(国別)(2020-2025)
8.2 中東・アフリカ地域 小児用循環補助装置の製品別売上高(2020-2025)
8.3 中東・アフリカ地域 小児用循環補助装置の売上高(用途別)(2020-2025)
8.4 エジプト
8.5 南アフリカ
8.6 イスラエル
8.7 トルコ
8.8 GCC諸国
9 市場動向、課題、およびトレンド
9.1 市場ドライバーと成長機会
9.2 市場課題とリスク
9.3 業界の動向
10 製造コスト構造分析
10.1 原材料とサプライヤー
10.2 小児用灌流製品の製造コスト構造分析
10.3 小児用灌流製品の製造プロセス分析
10.4 小児用灌流製品の産業チェーン構造
11 マーケティング、販売代理店および顧客
11.1 販売チャネル
11.1.1 直接チャネル
11.1.2 間接チャネル
11.2 小児用循環補助装置の卸売業者
11.3 小児用循環支援製品顧客
12 地域別小児用循環支援製品の世界市場予測レビュー
12.1 地域別小児用循環支援製品市場規模予測
12.1.1 地域別小児用循環支援製品市場予測(2026-2031)
12.1.2 地域別小児用循環補助装置年間売上高予測(2026-2031)
12.2 アメリカ地域別予測(2026-2031)
12.3 アジア太平洋地域別予測(2026-2031)
12.4 欧州地域別予測(2026-2031年)
12.5 中東・アフリカ地域別予測(2026-2031年)
12.6 グローバル小児用灌流製品市場予測(タイプ別)(2026-2031年)
12.7 グローバル小児用循環支援製品市場予測(用途別)(2026-2031)
13 主要企業分析
13.1 メドトロニック
13.1.1 メドトロニック企業情報
13.1.2 メドトロニックの小児用循環補助装置製品ポートフォリオと仕様
13.1.3 メドトロニックの小児用循環補助装置の売上高、収益、価格、粗利益率(2020-2025)
13.1.4 メドトロニックの主要事業概要
13.1.5 メドトロニックの最新動向
13.2 ソリン・グループ
13.2.1 ソリン・グループ企業情報
13.2.2 ソリン・グループ 小児用循環支援製品 製品ポートフォリオと仕様
13.2.3 ソリン・グループ 小児用循環支援製品の販売額、売上高、価格、および粗利益率(2020-2025)
13.2.4 ソリン・グループ 主な事業概要
13.2.5 ソリン・グループ 最新動向
13.3 テルモ
13.3.1 テルモ会社概要
13.3.2 テルモ小児用循環支援製品製品ポートフォリオと仕様
13.3.3 テルモ小児用循環支援製品の販売額、売上高、価格、粗利益率(2020-2025)
13.3.4 テルモの主要事業概要
13.3.5 テルモの最新動向
13.4 BLライフサイエンス
13.4.1 BLライフサイエンス 会社概要
13.4.2 BLライフサイエンス 小児用循環補助製品 製品ポートフォリオと仕様
13.4.3 BLライフサイエンス 小児用循環補助製品の販売額、売上高、価格、粗利益率(2020-2025)
13.4.4 BLライフサイエンス 主な事業概要
13.4.5 BLライフサイエンスの最新動向
13.5 フィリップス・ヘルスケア
13.5.1 フィリップス・ヘルスケア 会社概要
13.5.2 フィリップス・ヘルスケア 小児用循環補助製品 製品ポートフォリオと仕様
13.5.3 フィリップス・ヘルスケア 小児用循環支援製品の販売、売上高、価格、粗利益率(2020-2025)
13.5.4 フィリップス・ヘルスケア 主な事業概要
13.5.5 フィリップス・ヘルスケアの最新動向
13.6 ユーロセット
13.6.1 Eurosets 会社情報
13.6.2 ユーロセットズ 小児用循環支援製品 製品ポートフォリオと仕様
13.6.3 ユーロセットズ 小児用循環支援製品の販売、売上高、価格、粗利益率(2020-2025)
13.6.4 ユーロセットズ 主な事業概要
13.6.5 Eurosetsの最新動向
13.7 GE Healthcare
13.7.1 GE Healthcare 会社概要
13.7.2 GE Healthcare 小児用循環支援製品製品ポートフォリオと仕様
13.7.3 GE Healthcare 小児用循環支援製品の販売、売上高、価格、粗利益率(2020-2025)
13.7.4 GE Healthcare 主な事業概要
13.7.5 GE Healthcareの最新動向
13.8 Nonin Medical Inc
13.8.1 Nonin Medical Inc 会社概要
13.8.2 Nonin Medical Inc 小児用循環支援製品製品ポートフォリオと仕様
13.8.3 Nonin Medical Inc 小児用循環支援製品の販売、売上高、価格、粗利益率(2020-2025)
13.8.4 Nonin Medical Inc 主な事業概要
13.8.5 Nonin Medical Inc 最新の動向
14 研究結果と結論
14.8.2 Nonin Medical Inc 小児用循環支援製品 製品ポートフォリオと仕様
1 Scope of the Report
1.1 Market Introduction
1.2 Years Considered
1.3 Research Objectives
1.4 Market Research Methodology
1.5 Research Process and Data Source
1.6 Economic Indicators
1.7 Currency Considered
1.8 Market Estimation Caveats
2 Executive Summary
2.1 World Market Overview
2.1.1 Global Pediatric Perfusion Products Annual Sales 2020-2031
2.1.2 World Current & Future Analysis for Pediatric Perfusion Products by Geographic Region, 2020, 2024 & 2031
2.1.3 World Current & Future Analysis for Pediatric Perfusion Products by Country/Region, 2020, 2024 & 2031
2.2 Pediatric Perfusion Products Segment by Type
2.2.1 Pediatric Cannulae
2.2.2 Pediatric Centrifugal Blood Pumps
2.2.3 Pediatric Arterial Filters
2.2.4 Hemoconcentrators
2.2.5 HMS Plus Hemostasis Management System
2.2.6 Pediatric Oxygenators
2.3 Pediatric Perfusion Products Sales by Type
2.3.1 Global Pediatric Perfusion Products Sales Market Share by Type (2020-2025)
2.3.2 Global Pediatric Perfusion Products Revenue and Market Share by Type (2020-2025)
2.3.3 Global Pediatric Perfusion Products Sale Price by Type (2020-2025)
2.4 Pediatric Perfusion Products Segment by Application
2.4.1 Hosptitals
2.4.2 Clinics
2.4.3 Other
2.5 Pediatric Perfusion Products Sales by Application
2.5.1 Global Pediatric Perfusion Products Sale Market Share by Application (2020-2025)
2.5.2 Global Pediatric Perfusion Products Revenue and Market Share by Application (2020-2025)
2.5.3 Global Pediatric Perfusion Products Sale Price by Application (2020-2025)
3 Global by Company
3.1 Global Pediatric Perfusion Products Breakdown Data by Company
3.1.1 Global Pediatric Perfusion Products Annual Sales by Company (2020-2025)
3.1.2 Global Pediatric Perfusion Products Sales Market Share by Company (2020-2025)
3.2 Global Pediatric Perfusion Products Annual Revenue by Company (2020-2025)
3.2.1 Global Pediatric Perfusion Products Revenue by Company (2020-2025)
3.2.2 Global Pediatric Perfusion Products Revenue Market Share by Company (2020-2025)
3.3 Global Pediatric Perfusion Products Sale Price by Company
3.4 Key Manufacturers Pediatric Perfusion Products Producing Area Distribution, Sales Area, Product Type
3.4.1 Key Manufacturers Pediatric Perfusion Products Product Location Distribution
3.4.2 Players Pediatric Perfusion Products Products Offered
3.5 Market Concentration Rate Analysis
3.5.1 Competition Landscape Analysis
3.5.2 Concentration Ratio (CR3, CR5 and CR10) & (2023-2025)
3.6 New Products and Potential Entrants
3.7 Market M&A Activity & Strategy
4 World Historic Review for Pediatric Perfusion Products by Geographic Region
4.1 World Historic Pediatric Perfusion Products Market Size by Geographic Region (2020-2025)
4.1.1 Global Pediatric Perfusion Products Annual Sales by Geographic Region (2020-2025)
4.1.2 Global Pediatric Perfusion Products Annual Revenue by Geographic Region (2020-2025)
4.2 World Historic Pediatric Perfusion Products Market Size by Country/Region (2020-2025)
4.2.1 Global Pediatric Perfusion Products Annual Sales by Country/Region (2020-2025)
4.2.2 Global Pediatric Perfusion Products Annual Revenue by Country/Region (2020-2025)
4.3 Americas Pediatric Perfusion Products Sales Growth
4.4 APAC Pediatric Perfusion Products Sales Growth
4.5 Europe Pediatric Perfusion Products Sales Growth
4.6 Middle East & Africa Pediatric Perfusion Products Sales Growth
5 Americas
5.1 Americas Pediatric Perfusion Products Sales by Country
5.1.1 Americas Pediatric Perfusion Products Sales by Country (2020-2025)
5.1.2 Americas Pediatric Perfusion Products Revenue by Country (2020-2025)
5.2 Americas Pediatric Perfusion Products Sales by Type (2020-2025)
5.3 Americas Pediatric Perfusion Products Sales by Application (2020-2025)
5.4 United States
5.5 Canada
5.6 Mexico
5.7 Brazil
6 APAC
6.1 APAC Pediatric Perfusion Products Sales by Region
6.1.1 APAC Pediatric Perfusion Products Sales by Region (2020-2025)
6.1.2 APAC Pediatric Perfusion Products Revenue by Region (2020-2025)
6.2 APAC Pediatric Perfusion Products Sales by Type (2020-2025)
6.3 APAC Pediatric Perfusion Products Sales by Application (2020-2025)
6.4 China
6.5 Japan
6.6 South Korea
6.7 Southeast Asia
6.8 India
6.9 Australia
6.10 China Taiwan
7 Europe
7.1 Europe Pediatric Perfusion Products by Country
7.1.1 Europe Pediatric Perfusion Products Sales by Country (2020-2025)
7.1.2 Europe Pediatric Perfusion Products Revenue by Country (2020-2025)
7.2 Europe Pediatric Perfusion Products Sales by Type (2020-2025)
7.3 Europe Pediatric Perfusion Products Sales by Application (2020-2025)
7.4 Germany
7.5 France
7.6 UK
7.7 Italy
7.8 Russia
8 Middle East & Africa
8.1 Middle East & Africa Pediatric Perfusion Products by Country
8.1.1 Middle East & Africa Pediatric Perfusion Products Sales by Country (2020-2025)
8.1.2 Middle East & Africa Pediatric Perfusion Products Revenue by Country (2020-2025)
8.2 Middle East & Africa Pediatric Perfusion Products Sales by Type (2020-2025)
8.3 Middle East & Africa Pediatric Perfusion Products Sales by Application (2020-2025)
8.4 Egypt
8.5 South Africa
8.6 Israel
8.7 Turkey
8.8 GCC Countries
9 Market Drivers, Challenges and Trends
9.1 Market Drivers & Growth Opportunities
9.2 Market Challenges & Risks
9.3 Industry Trends
10 Manufacturing Cost Structure Analysis
10.1 Raw Material and Suppliers
10.2 Manufacturing Cost Structure Analysis of Pediatric Perfusion Products
10.3 Manufacturing Process Analysis of Pediatric Perfusion Products
10.4 Industry Chain Structure of Pediatric Perfusion Products
11 Marketing, Distributors and Customer
11.1 Sales Channel
11.1.1 Direct Channels
11.1.2 Indirect Channels
11.2 Pediatric Perfusion Products Distributors
11.3 Pediatric Perfusion Products Customer
12 World Forecast Review for Pediatric Perfusion Products by Geographic Region
12.1 Global Pediatric Perfusion Products Market Size Forecast by Region
12.1.1 Global Pediatric Perfusion Products Forecast by Region (2026-2031)
12.1.2 Global Pediatric Perfusion Products Annual Revenue Forecast by Region (2026-2031)
12.2 Americas Forecast by Country (2026-2031)
12.3 APAC Forecast by Region (2026-2031)
12.4 Europe Forecast by Country (2026-2031)
12.5 Middle East & Africa Forecast by Country (2026-2031)
12.6 Global Pediatric Perfusion Products Forecast by Type (2026-2031)
12.7 Global Pediatric Perfusion Products Forecast by Application (2026-2031)
13 Key Players Analysis
13.1 Medtronic
13.1.1 Medtronic Company Information
13.1.2 Medtronic Pediatric Perfusion Products Product Portfolios and Specifications
13.1.3 Medtronic Pediatric Perfusion Products Sales, Revenue, Price and Gross Margin (2020-2025)
13.1.4 Medtronic Main Business Overview
13.1.5 Medtronic Latest Developments
13.2 Sorin Group
13.2.1 Sorin Group Company Information
13.2.2 Sorin Group Pediatric Perfusion Products Product Portfolios and Specifications
13.2.3 Sorin Group Pediatric Perfusion Products Sales, Revenue, Price and Gross Margin (2020-2025)
13.2.4 Sorin Group Main Business Overview
13.2.5 Sorin Group Latest Developments
13.3 Terumo
13.3.1 Terumo Company Information
13.3.2 Terumo Pediatric Perfusion Products Product Portfolios and Specifications
13.3.3 Terumo Pediatric Perfusion Products Sales, Revenue, Price and Gross Margin (2020-2025)
13.3.4 Terumo Main Business Overview
13.3.5 Terumo Latest Developments
13.4 BL Lifesciences
13.4.1 BL Lifesciences Company Information
13.4.2 BL Lifesciences Pediatric Perfusion Products Product Portfolios and Specifications
13.4.3 BL Lifesciences Pediatric Perfusion Products Sales, Revenue, Price and Gross Margin (2020-2025)
13.4.4 BL Lifesciences Main Business Overview
13.4.5 BL Lifesciences Latest Developments
13.5 Philips Healthcare
13.5.1 Philips Healthcare Company Information
13.5.2 Philips Healthcare Pediatric Perfusion Products Product Portfolios and Specifications
13.5.3 Philips Healthcare Pediatric Perfusion Products Sales, Revenue, Price and Gross Margin (2020-2025)
13.5.4 Philips Healthcare Main Business Overview
13.5.5 Philips Healthcare Latest Developments
13.6 Eurosets
13.6.1 Eurosets Company Information
13.6.2 Eurosets Pediatric Perfusion Products Product Portfolios and Specifications
13.6.3 Eurosets Pediatric Perfusion Products Sales, Revenue, Price and Gross Margin (2020-2025)
13.6.4 Eurosets Main Business Overview
13.6.5 Eurosets Latest Developments
13.7 GE Healthcare
13.7.1 GE Healthcare Company Information
13.7.2 GE Healthcare Pediatric Perfusion Products Product Portfolios and Specifications
13.7.3 GE Healthcare Pediatric Perfusion Products Sales, Revenue, Price and Gross Margin (2020-2025)
13.7.4 GE Healthcare Main Business Overview
13.7.5 GE Healthcare Latest Developments
13.8 Nonin Medical Inc
13.8.1 Nonin Medical Inc Company Information
13.8.2 Nonin Medical Inc Pediatric Perfusion Products Product Portfolios and Specifications
13.8.3 Nonin Medical Inc Pediatric Perfusion Products Sales, Revenue, Price and Gross Margin (2020-2025)
13.8.4 Nonin Medical Inc Main Business Overview
13.8.5 Nonin Medical Inc Latest Developments
14 Research Findings and Conclusion
| ※参考情報 小児用灌流製品は、小児患者における心臓手術やその他の手術、特に循環を必要とする状況で使用される医療機器や技術の総称です。これらの製品は、主に小児の体のサイズや生理的特性に合わせて設計されており、小児特有の解剖学的条件や生理学的応答に配慮しています。小児用灌流製品の定義、特徴、種類、用途、そして関連技術について述べていきます。 小児用灌流製品の定義は、主に小児患者の血液循環を支持するために使用される装置や機器を指します。これには、心臓手術の際に心臓と体の間で血液を循環させるための体外循環装置や、薬剤の投与を自動化するためのポンプなどが含まれます。これらの製品は、小児患者の体重や年齢、病状に応じて調整され、成人用の製品がそのまま使用されることはありません。 小児用灌流製品の特徴には、以下の点が挙げられます。まず第一に、小児患者の身体サイズに応じた設計がなされているため、成人向けの製品よりもコンパクトで軽量です。これにより、手術中の利便性が向上し、操作性が高まります。また、小児患者は成長過程にあり、身体の生理的状態が成人と異なるため、灌流製品もその生理的ニーズに応じて調整されています。たとえば、小児は成人よりも血液量が少なく、心拍数や血圧の範囲も異なります。そのため、灌流製品には適切な流量調整機能やモニタリング機能が盛り込まれていることが求められます。 小児用灌流製品には、さまざまな種類があります。体外循環を行うための心肺バイパス装置(心肺補助装置)は、その代表的なものです。これらの装置は、心臓手術中に患者の血液を体外に取り出し、酸素供給や二酸化炭素除去を行った後に、再び体内に戻すために使用されます。さらに、心拍出量をサポートするための機械式心臓や、血液循環を促進するためのポンプ、灌流液を均等に分配するための灌流器も含まれます。 小児用灌流製品の用途は広範であり、心臓手術や移植手術、重篤な病状を有する小児患者の治療に使用されます。これらの手術では、心肺補助が必要な場合が多く、小児用灌流製品が重要な役割を果たします。また、心臓疾患や先天性心疾患を持つ小児患者に対する治療においても、これらの製品は不可欠です。 さらに、小児用灌流製品の関連技術も興味深い分野です。例えば、遠隔モニタリング技術の発展により、手術中や回復期における小児患者の生理的データをリアルタイムで監視することが可能になっています。この技術によって、医療スタッフは迅速に患者の状態を把握し、必要に応じて迅速な対応ができるようになります。また、人工知能(AI)や機械学習技術の導入により、患者のデータを解析し、個別化された治療戦略の提案が期待されています。 小児用灌流製品の開発には、多くの課題が存在します。小児患者は成長途中にあり、それぞれの患者において解剖学的および生理的条件が異なるため、製品の標準化が難しいとされています。また、安全性の確保や、バイオコンパチビリティ、使用後の廃棄物処理も重要な課題です。これらの課題を克服するために、研究者やメーカーは新しい材料やデザインの探索を続けており、技術の革新が期待されています。 最後に、小児用灌流製品は小児医療において欠かせない要素であり、技術の進歩により今後もその役割がますます重要になると考えられます。小児患者の生命を支えるために、これらの製品は日々進化を続け、その安全性および効果の向上に寄与していくことでしょう。医療現場におけるより良い結果を生むために、小児用灌流製品の開発や適切な使用、さらには教育と訓練が今後も求められるでしょう。 |
❖ 免責事項 ❖
http://www.globalresearch.jp/disclaimer