1 報告の範囲
1.1 市場概要
1.2 対象期間
1.3 研究目的
1.4 市場調査手法
1.5 研究プロセスとデータソース
1.6 経済指標
1.7 対象通貨
1.8 市場推計の留意点
2 執行要約
2.1 世界市場の概要
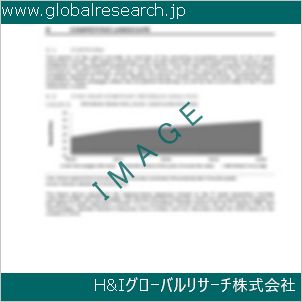
2.1.1 グローバル・フルベンダゾール年間販売量(2020年~2031年)
2.1.2 地域別フベンダゾール市場(2020年、2024年、2031年)の現状と将来分析
2.1.3 地域別フベンダゾール市場(2020年、2024年、2031年)の現状と将来予測
2.2 フルベンダゾールセグメント別分析(タイプ別)
2.2.1 ≥98%
2.2.2 ≥99%
2.2.3 その他
2.3 タイプ別フベンダゾール販売量
2.3.1 グローバル・フルベンダゾール販売市場シェア(種類別)(2020-2025)
2.3.2 グローバル・フルベンダゾール売上高と市場シェア(種類別)(2020-2025)
2.3.3 グローバル・フルベンダゾール販売価格(種類別)(2020-2025)
2.4 フルベンダゾールセグメント別用途
2.4.1 飼料添加物
2.4.2 錠剤
2.4.3 経口液剤
2.5 フルベンダゾール販売量(用途別)
2.5.1 グローバル・フルベンダゾール販売市場シェア(用途別)(2020-2025)
2.5.2 グローバル・フルベンダゾール売上高と市場シェア(用途別)(2020-2025)
2.5.3 グローバル・フルベンダゾール販売価格(用途別)(2020-2025)
3 グローバル企業別
3.1 グローバル・フルベンダゾール市場における企業別内訳データ
3.1.1 グローバル・フルベンダゾール年間販売量(企業別)(2020-2025)
3.1.2 グローバル・フルベンダゾール売上高市場シェア(企業別)(2020-2025)
3.2 グローバル・フルベンダゾール年間売上高(企業別)(2020-2025)
3.2.1 グローバル・フルベンダゾール売上高(企業別)(2020-2025)
3.2.2 グローバル・フルベンダゾール売上高市場シェア(企業別)(2020-2025)
3.3 グローバル・フルベンダゾール販売価格(企業別)
3.4 主要メーカーのフルベンダゾール製造地域分布、販売地域、製品タイプ
3.4.1 主要メーカーのフルベンダゾール製品所在地分布
3.4.2 主要メーカーのフルベンダゾール製品ラインナップ
3.5 市場集中率分析
3.5.1 競争環境分析
3.5.2 集中率(CR3、CR5、CR10)および(2023-2025)
3.6 新製品と潜在的な新規参入企業
3.7 市場M&A活動と戦略
4 地域別フベンダゾールの世界歴史的動向
4.1 地域別フベンダゾール市場規模(2020-2025)
4.1.1 地域別フベンダゾール年間販売額(2020-2025)
4.1.2 地域別フベンダゾール年間売上高(2020-2025)
4.2 世界フベンダゾール市場規模(国/地域別)(2020-2025)
4.2.1 グローバル・フルベンダゾール年間販売量(国/地域別)(2020-2025)
4.2.2 グローバル・フルベンダゾール年間売上高(地域別/国別)(2020-2025)
4.3 アメリカズ地域におけるフルベンダゾール販売成長率
4.4 アジア太平洋地域におけるフルベンダゾール販売成長率
4.5 ヨーロッパのフルベンダゾール販売成長
4.6 中東・アフリカ地域におけるフルベンダゾール販売成長率
5 アメリカ
5.1 アメリカズ フルベンダゾール販売量(国別)
5.1.1 アメリカズ フルベンダゾール販売量(国別)(2020-2025)
5.1.2 アメリカズ フルベンダゾール売上高(国別)(2020-2025)
5.2 アメリカズ フルベンダゾール販売量(種類別)(2020-2025)
5.3 アメリカズ フルベンダゾール販売量(用途別)(2020-2025)
5.4 アメリカ合衆国
5.5 カナダ
5.6 メキシコ
5.7 ブラジル
6 アジア太平洋
6.1 APAC地域別フルベンダゾール販売額
6.1.1 APAC地域別フルベンダゾール販売量(2020-2025)
6.1.2 APAC地域別フルベンダゾール売上高(2020-2025)
6.2 アジア太平洋地域(APAC)のフルベンダゾール販売量(2020-2025)
6.3 APAC フルベンダゾール販売量(地域別)(2020-2025)
6.4 中国
6.5 日本
6.6 韓国
6.7 東南アジア
6.8 インド
6.9 オーストラリア
6.10 中国・台湾
7 ヨーロッパ
7.1 ヨーロッパのフルベンダゾール市場(国別)
7.1.1 ヨーロッパのフルベンダゾール販売量(2020-2025年)
7.1.2 ヨーロッパ フルベンダゾール売上高(国別)(2020-2025)
7.2 ヨーロッパ フルベンダゾール 種類別販売量(2020-2025)
7.3 ヨーロッパのフルベンダゾール販売量(用途別)(2020-2025)
7.4 ドイツ
7.5 フランス
7.6 イギリス
7.7 イタリア
7.8 ロシア
8 中東・アフリカ
8.1 中東・アフリカ地域別フルベンダゾール市場
8.1.1 中東・アフリカ地域におけるフベンダゾール販売量(2020-2025年)
8.1.2 中東・アフリカ地域におけるフルベンダゾール売上高(国別)(2020-2025)
8.2 中東・アフリカ地域におけるフルベンダゾール販売量(2020-2025年)
8.3 中東・アフリカ地域におけるフルベンダゾール販売量(用途別)(2020-2025)
8.4 エジプト
8.5 南アフリカ
8.6 イスラエル
8.7 トルコ
8.8 GCC諸国
9 市場動向、課題、およびトレンド
9.1 市場ドライバーと成長機会
9.2 市場課題とリスク
9.3 業界の動向
10 製造コスト構造分析
10.1 原材料とサプライヤー
10.2 フルベンダゾールの製造コスト構造分析
10.3 フルベンダゾールの製造プロセス分析
10.4 フルベンダゾールの産業チェーン構造
11 マーケティング、販売代理店および顧客
11.1 販売チャネル
11.1.1 直接チャネル
11.1.2 間接チャネル
11.2 フルベンダゾール販売代理店
11.3 フルベンダゾール顧客
12 地域別フブエンダゾールの世界市場予測レビュー
12.1 地域別フベンダゾール市場規模予測
12.1.1 地域別フベンダゾール予測(2026-2031)
12.1.2 地域別グローバルフブエンダゾール年間売上高予測(2026-2031)
12.2 アメリカ地域別予測(2026-2031)
12.3 アジア太平洋地域別予測(2026-2031)
12.4 欧州地域別予測(2026-2031年)
12.5 中東・アフリカ地域別予測(2026-2031年)
12.6 グローバル・フルベンダゾール予測(タイプ別)(2026-2031)
12.7 グローバル・フルベンダゾール市場予測(用途別)(2026-2031年)
13 主要企業分析
13.1 ヤンセン・ファーマシューティカ・エヌ・ブイ
13.1.1 ヤンセン・ファーマシューティカ・エヌ・ヴィー 会社概要
13.1.2 ヤンセン・ファーマシューティカ・エヌ・ブイのフルベンダゾール製品ポートフォリオと仕様
13.1.3 ヤンセン・ファーマシューティカ・エヌ・ヴィーのフルベンダゾール売上高、売上高、価格、粗利益率(2020-2025)
13.1.4 ヤンセン・ファーマシューティカ・エヌ・ヴィー 主な事業概要
13.1.5 ヤンセン・ファーマシューティカ・エヌ・ヴィーの最新動向
13.2 チャンチョウ・ヤバン-QH ファーマケム
13.2.1 常州ヤバン・QH ファーマケム 会社情報
13.2.2 常州ヤバン・QH ファーマケム フルベンダゾール製品ポートフォリオと仕様
13.2.3 常州ヤバン・QH ファーマケム フルベンダゾール 売上高、収益、価格、粗利益率(2020-2025)
13.2.4 常州ヤバン・QH ファーマケム 主な事業概要
13.2.5 常州ヤバン・QH ファーマケミカルの最新動向
13.3 山西漢江製薬
13.3.1 山西漢江製薬会社情報
13.3.2 山西漢江製薬のフルベンダゾール製品ポートフォリオと仕様
13.3.3 山西漢江製薬のフルベンダゾール販売量、売上高、価格、粗利益率(2020-2025)
13.3.4 山西漢江製薬 主な事業概要
13.3.5 山西漢江製薬の最新動向
14 研究結果と結論
14.3.3 山西漢江製薬 フルベンダゾール製品ポートフォリオと仕様
1 Scope of the Report
1.1 Market Introduction
1.2 Years Considered
1.3 Research Objectives
1.4 Market Research Methodology
1.5 Research Process and Data Source
1.6 Economic Indicators
1.7 Currency Considered
1.8 Market Estimation Caveats
2 Executive Summary
2.1 World Market Overview
2.1.1 Global Flubendazole Annual Sales 2020-2031
2.1.2 World Current & Future Analysis for Flubendazole by Geographic Region, 2020, 2024 & 2031
2.1.3 World Current & Future Analysis for Flubendazole by Country/Region, 2020, 2024 & 2031
2.2 Flubendazole Segment by Type
2.2.1 ≥98%
2.2.2 ≥99%
2.2.3 Other
2.3 Flubendazole Sales by Type
2.3.1 Global Flubendazole Sales Market Share by Type (2020-2025)
2.3.2 Global Flubendazole Revenue and Market Share by Type (2020-2025)
2.3.3 Global Flubendazole Sale Price by Type (2020-2025)
2.4 Flubendazole Segment by Application
2.4.1 Feed Additives
2.4.2 Tablet
2.4.3 Oral Liquids
2.5 Flubendazole Sales by Application
2.5.1 Global Flubendazole Sale Market Share by Application (2020-2025)
2.5.2 Global Flubendazole Revenue and Market Share by Application (2020-2025)
2.5.3 Global Flubendazole Sale Price by Application (2020-2025)
3 Global by Company
3.1 Global Flubendazole Breakdown Data by Company
3.1.1 Global Flubendazole Annual Sales by Company (2020-2025)
3.1.2 Global Flubendazole Sales Market Share by Company (2020-2025)
3.2 Global Flubendazole Annual Revenue by Company (2020-2025)
3.2.1 Global Flubendazole Revenue by Company (2020-2025)
3.2.2 Global Flubendazole Revenue Market Share by Company (2020-2025)
3.3 Global Flubendazole Sale Price by Company
3.4 Key Manufacturers Flubendazole Producing Area Distribution, Sales Area, Product Type
3.4.1 Key Manufacturers Flubendazole Product Location Distribution
3.4.2 Players Flubendazole Products Offered
3.5 Market Concentration Rate Analysis
3.5.1 Competition Landscape Analysis
3.5.2 Concentration Ratio (CR3, CR5 and CR10) & (2023-2025)
3.6 New Products and Potential Entrants
3.7 Market M&A Activity & Strategy
4 World Historic Review for Flubendazole by Geographic Region
4.1 World Historic Flubendazole Market Size by Geographic Region (2020-2025)
4.1.1 Global Flubendazole Annual Sales by Geographic Region (2020-2025)
4.1.2 Global Flubendazole Annual Revenue by Geographic Region (2020-2025)
4.2 World Historic Flubendazole Market Size by Country/Region (2020-2025)
4.2.1 Global Flubendazole Annual Sales by Country/Region (2020-2025)
4.2.2 Global Flubendazole Annual Revenue by Country/Region (2020-2025)
4.3 Americas Flubendazole Sales Growth
4.4 APAC Flubendazole Sales Growth
4.5 Europe Flubendazole Sales Growth
4.6 Middle East & Africa Flubendazole Sales Growth
5 Americas
5.1 Americas Flubendazole Sales by Country
5.1.1 Americas Flubendazole Sales by Country (2020-2025)
5.1.2 Americas Flubendazole Revenue by Country (2020-2025)
5.2 Americas Flubendazole Sales by Type (2020-2025)
5.3 Americas Flubendazole Sales by Application (2020-2025)
5.4 United States
5.5 Canada
5.6 Mexico
5.7 Brazil
6 APAC
6.1 APAC Flubendazole Sales by Region
6.1.1 APAC Flubendazole Sales by Region (2020-2025)
6.1.2 APAC Flubendazole Revenue by Region (2020-2025)
6.2 APAC Flubendazole Sales by Type (2020-2025)
6.3 APAC Flubendazole Sales by Application (2020-2025)
6.4 China
6.5 Japan
6.6 South Korea
6.7 Southeast Asia
6.8 India
6.9 Australia
6.10 China Taiwan
7 Europe
7.1 Europe Flubendazole by Country
7.1.1 Europe Flubendazole Sales by Country (2020-2025)
7.1.2 Europe Flubendazole Revenue by Country (2020-2025)
7.2 Europe Flubendazole Sales by Type (2020-2025)
7.3 Europe Flubendazole Sales by Application (2020-2025)
7.4 Germany
7.5 France
7.6 UK
7.7 Italy
7.8 Russia
8 Middle East & Africa
8.1 Middle East & Africa Flubendazole by Country
8.1.1 Middle East & Africa Flubendazole Sales by Country (2020-2025)
8.1.2 Middle East & Africa Flubendazole Revenue by Country (2020-2025)
8.2 Middle East & Africa Flubendazole Sales by Type (2020-2025)
8.3 Middle East & Africa Flubendazole Sales by Application (2020-2025)
8.4 Egypt
8.5 South Africa
8.6 Israel
8.7 Turkey
8.8 GCC Countries
9 Market Drivers, Challenges and Trends
9.1 Market Drivers & Growth Opportunities
9.2 Market Challenges & Risks
9.3 Industry Trends
10 Manufacturing Cost Structure Analysis
10.1 Raw Material and Suppliers
10.2 Manufacturing Cost Structure Analysis of Flubendazole
10.3 Manufacturing Process Analysis of Flubendazole
10.4 Industry Chain Structure of Flubendazole
11 Marketing, Distributors and Customer
11.1 Sales Channel
11.1.1 Direct Channels
11.1.2 Indirect Channels
11.2 Flubendazole Distributors
11.3 Flubendazole Customer
12 World Forecast Review for Flubendazole by Geographic Region
12.1 Global Flubendazole Market Size Forecast by Region
12.1.1 Global Flubendazole Forecast by Region (2026-2031)
12.1.2 Global Flubendazole Annual Revenue Forecast by Region (2026-2031)
12.2 Americas Forecast by Country (2026-2031)
12.3 APAC Forecast by Region (2026-2031)
12.4 Europe Forecast by Country (2026-2031)
12.5 Middle East & Africa Forecast by Country (2026-2031)
12.6 Global Flubendazole Forecast by Type (2026-2031)
12.7 Global Flubendazole Forecast by Application (2026-2031)
13 Key Players Analysis
13.1 Janssen Pharmaceutica N.V.
13.1.1 Janssen Pharmaceutica N.V. Company Information
13.1.2 Janssen Pharmaceutica N.V. Flubendazole Product Portfolios and Specifications
13.1.3 Janssen Pharmaceutica N.V. Flubendazole Sales, Revenue, Price and Gross Margin (2020-2025)
13.1.4 Janssen Pharmaceutica N.V. Main Business Overview
13.1.5 Janssen Pharmaceutica N.V. Latest Developments
13.2 Changzhou Yabang-QH Pharmachem
13.2.1 Changzhou Yabang-QH Pharmachem Company Information
13.2.2 Changzhou Yabang-QH Pharmachem Flubendazole Product Portfolios and Specifications
13.2.3 Changzhou Yabang-QH Pharmachem Flubendazole Sales, Revenue, Price and Gross Margin (2020-2025)
13.2.4 Changzhou Yabang-QH Pharmachem Main Business Overview
13.2.5 Changzhou Yabang-QH Pharmachem Latest Developments
13.3 Shanxi Hanjiang pharmaceutical
13.3.1 Shanxi Hanjiang pharmaceutical Company Information
13.3.2 Shanxi Hanjiang pharmaceutical Flubendazole Product Portfolios and Specifications
13.3.3 Shanxi Hanjiang pharmaceutical Flubendazole Sales, Revenue, Price and Gross Margin (2020-2025)
13.3.4 Shanxi Hanjiang pharmaceutical Main Business Overview
13.3.5 Shanxi Hanjiang pharmaceutical Latest Developments
14 Research Findings and Conclusion
| ※参考情報 フルベンダゾールは、主に寄生虫感染症の治療に用いられる広範囲な抗寄生虫薬で、特に腸管内寄生虫や外部寄生虫に対して効果を示します。この薬は、ベンゾイミダゾール類に属し、虫体の代謝を阻害することで寄生虫を駆除します。以下にその特徴、種類、用途、関連技術について詳しく述べます。 フルベンダゾールの定義としては、合成された抗寄生虫薬であり、特に腸管寄生虫に対して高い効果を示すことが知られています。この薬は特に小腸において、寄生虫の微小管に作用し、その発育や増殖を妨げることにより、最終的に寄生虫を死滅させることが特徴です。また、フルベンダゾールは水溶性が低いため、経口投与が中心となりますが、動物医療においては様々な形態で使用されることがあります。 フルベンダゾールの特徴として、まずその広範な抗寄生虫効果が挙げられます。特に、線虫、吸虫、条虫に対して有効であり、これにより多くの寄生虫病の治療において第一選択薬とされることも少なくありません。さらに、フルベンダゾールは体内での持続効果が高く、通常1日1回の投与で良好な効果が得られます。この点は、患者の服薬アドヒアランスを高める要因ともなります。 フルベンダゾールの種類には、主に経口投与用のタブレットやサスペンションがあります。動物に対しては、特に家畜やペットに用いられることが多く、さまざまな動物種にも対応した製剤が開発されています。また、一定の濃度でフルベンダゾールを含む複数の製品が存在しており、それぞれ目的や用途に応じて使い分けられています。例えば、牛、豚、羊などの家畜向けには高用量の製剤が存在する一方、犬や猫などの小動物用には低用量の製剤が一般的です。 フルベンダゾールの用途としては、主に寄生虫感染症の治療が挙げられます。具体的には、ヒトにおいては腸管糞線虫、ギアニウム、各種の条虫(特にEchinococcus種)に対して有効です。動物においても、同様の寄生虫に加えて、多くの種類の腸管内寄生虫に対する治療に用いられています。また、最近では飼育下の動物の健康管理を目的として、定期的な駆虫が推奨されることも多くなり、その際にフルベンダゾールが使用されるケースが増えています。 関連技術としては、フルベンダゾールの分子構造や代謝経路に関する研究が進んでおり、寄生虫の耐性に対する理解を深めることが重要視されています。これにより、より効果的で安全な治療法の開発や、耐性を持つ寄生虫への対策が模索されています。また、フルベンダゾールの投与に伴う副作用についての研究も進められており、これにより、使用時のリスクを低減する方策が検討されています。 フルベンダゾールは、抗寄生虫治療だけでなく、予防的な観点からも重要性を持ちます。特に動物の飼育環境においては、寄生虫感染を防ぐことで、健康な成長を促進し、畜産業の生産性を向上させる要因となります。また、フルベンダゾールにより寄生虫感染が減少することで、農業生産物の品質向上や、ヒトに対する感染症のリスク軽減にも寄与すると考えられています。 近年では、フルベンダゾールの使用に関連した研究や新たな治療法の開発も活発に行われています。特に、寄生虫の耐性問題に対する研究が進展しており、新たな薬剤の開発や、フルベンダゾールを含む複数成分の併用療法が模索されています。これにより、より効果的な寄生虫治療が可能となることが期待されています。 このように、フルベンダゾールは、寄生虫感染症の治療において広く用いられ、その効果の高さと安全性から、多くの患者や動物の健康を支える重要な役割を果たしています。今後もその研究や応用は続けられ、新たな技術の進展により、さらなる治療効果の向上が期待されている状況です。特に、動物医療分野においては、持続的な効果と副作用の低減が求められており、これを通じて動物そして人間の健康に貢献していくことが必要不可欠です。 |
❖ 免責事項 ❖
http://www.globalresearch.jp/disclaimer