1 報告の範囲
1.1 市場概要
1.2 対象期間
1.3 研究目的
1.4 市場調査手法
1.5 研究プロセスとデータソース
1.6 経済指標
1.7 対象通貨
1.8 市場推計の留意点
2 執行要約
2.1 世界市場の概要
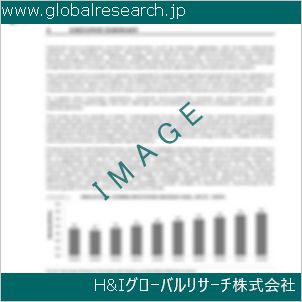
2.1.1 薬物乱用診断キットの世界年間販売額(2020年~2031年)
2.1.2 地域別薬物診断キットの市場分析(2020年、2024年、2031年)
2.1.3 薬物乱用診断キットの世界市場動向(国/地域別)2020年、2024年、2031年
2.2 薬物乱用診断キットのセグメント別分析(タイプ別)
2.2.1 尿検査
2.2.2 唾液検査
2.2.3 血液検査
2.3 薬物乱用診断キットの売上高(タイプ別)
2.3.1 薬物乱用診断キットのグローバル販売市場シェア(種類別)(2020-2025)
2.3.2 薬物乱用診断キットの売上高と市場シェア(種類別)(2020-2025)
2.3.3 薬物乱用診断キットのタイプ別販売価格(2020-2025)
2.4 薬物乱用診断キットのセグメント別アプリケーション
2.4.1 病院
2.4.2 クリニック
2.4.3 家庭
2.5 薬物乱用診断キットの用途別販売額
2.5.1 グローバルな薬物乱用診断キットの売上市場シェア(用途別)(2020-2025)
2.5.2 薬物乱用診断キットの売上高と市場シェア(用途別)(2020-2025)
2.5.3 薬物乱用診断キットの用途別販売価格(2020-2025)
3 グローバル企業別
3.1 薬物乱用診断キットの企業別内訳データ
3.1.1 グローバル薬物乱用診断キットの年間売上高(企業別)(2020-2025)
3.1.2 薬物乱用診断キットの世界市場シェア(企業別)(2020-2025)
3.2 薬物乱用診断キットの年間売上高(企業別)(2020-2025)
3.2.1 薬物乱用診断キットの企業別売上高(2020-2025)
3.2.2 薬物乱用診断キットの売上高市場シェア(企業別)(2020-2025)
3.3 薬物乱用診断キットの企業別販売価格
3.4 薬物乱用診断キットの主要製造業者 製造地域分布、販売地域、製品タイプ
3.4.1 主要メーカーの薬物乱用診断キットの製品所在地分布
3.4.2 主要メーカーが提供する薬物乱用診断キット製品
3.5 市場集中率分析
3.5.1 競争環境分析
3.5.2 集中率(CR3、CR5、CR10)および(2023-2025)
3.6 新製品と潜在的な新規参入者
3.7 市場M&A活動と戦略
4 地域別薬物乱用診断キットの世界歴史的レビュー
4.1 世界における薬物乱用診断キット市場規模の地域別歴史的動向(2020-2025)
4.1.1 世界における薬物乱用診断キットの地域別年間売上高(2020-2025)
4.1.2 世界における薬物乱用診断キットの地域別年間売上高(2020-2025)
4.2 世界における薬物乱用診断キット市場規模(地域別)(2020-2025)
4.2.1 薬物乱用診断キットの年間販売額(地域別)(2020-2025)
4.2.2 薬物乱用診断キットの年間売上高(国/地域別)(2020-2025)
4.3 アメリカズ地域における薬物乱用診断キットの売上成長率
4.4 アジア太平洋地域 薬物乱用診断キットの売上高成長率
4.5 欧州 薬物乱用診断キットの売上高成長率
4.6 中東・アフリカ地域 薬物乱用診断キットの売上高成長率
5 アメリカ
5.1 アメリカズ 薬物乱用診断キットの売上高(国別)
5.1.1 アメリカズ 薬物乱用診断キットの売上高(国別)(2020-2025)
5.1.2 アメリカズ 薬物乱用診断キットの売上高(国別)(2020-2025)
5.2 アメリカズ 薬物乱用診断キットの売上高(種類別)(2020-2025)
5.3 アメリカズ 薬物乱用診断キットの売上高(用途別)(2020-2025)
5.4 アメリカ合衆国
5.5 カナダ
5.6 メキシコ
5.7 ブラジル
6 アジア太平洋
6.1 APAC地域別薬物乱用診断キットの販売状況
6.1.1 APAC地域別薬物乱用診断キット販売額(2020-2025)
6.1.2 アジア太平洋地域(APAC)における薬物乱用診断キットの売上高(地域別)(2020-2025)
6.2 アジア太平洋地域(APAC)における薬物乱用診断キットの売上高(2020-2025年)
6.3 アジア太平洋地域(APAC)における薬物乱用診断キットの販売額(2020-2025年)
6.4 中国
6.5 日本
6.6 韓国
6.7 東南アジア
6.8 インド
6.9 オーストラリア
6.10 中国・台湾
7 ヨーロッパ
7.1 欧州 薬物乱用診断キットの地域別販売額(2020-2025)
7.1.1 欧州 薬物乱用診断キットの売上高(国別)(2020-2025)
7.1.2 欧州 薬物乱用診断キットの売上高(国別)(2020-2025)
7.2 欧州 薬物乱用診断キットの売上高(種類別)(2020-2025)
7.3 欧州 薬物乱用診断キット 用途別販売量(2020-2025)
7.4 ドイツ
7.5 フランス
7.6 イギリス
7.7 イタリア
7.8 ロシア
8 中東・アフリカ
8.1 中東・アフリカ 薬物乱用診断キット(国別)
8.1.1 中東・アフリカ地域 薬物乱用診断キットの売上高(国別)(2020-2025)
8.1.2 中東・アフリカ地域 薬物乱用診断キットの売上高(国別)(2020-2025)
8.2 中東・アフリカ地域における薬物乱用診断キットの売上高(種類別)(2020-2025)
8.3 中東・アフリカ地域における薬物乱用診断キットの売上高(用途別)(2020-2025)
8.4 エジプト
8.5 南アフリカ
8.6 イスラエル
8.7 トルコ
8.8 GCC諸国
9 市場動向、課題、およびトレンド
9.1 市場ドライバーと成長機会
9.2 市場課題とリスク
9.3 業界の動向
10 製造コスト構造分析
10.1 原材料とサプライヤー
10.2 薬物乱用診断キットの製造コスト構造分析
10.3 薬物乱用診断キットの製造プロセス分析
10.4 薬物乱用診断キットの産業チェーン構造
11 マーケティング、販売代理店および顧客
11.1 販売チャネル
11.1.1 直接チャネル
11.1.2 間接チャネル
11.2 薬物乱用診断キットの卸売業者
11.3 薬物乱用診断キットの顧客
12 地域別薬物乱用診断キットの世界市場予測レビュー
12.1 地域別薬物乱用診断キット市場規模予測
12.1.1 地域別薬物乱用診断キット市場規模予測(2026-2031)
12.1.2 地域別薬物乱用診断キットの年間売上高予測(2026-2031)
12.2 アメリカ地域別予測(2026-2031)
12.3 アジア太平洋地域別予測(2026-2031)
12.4 欧州地域別予測(2026-2031年)
12.5 中東・アフリカ地域別予測(2026-2031)
12.6 薬物乱用診断キットの世界市場予測(タイプ別)(2026-2031年)
12.7 薬物乱用診断キットの世界市場予測(用途別)(2026-2031)
13 主要企業分析
13.1 アボット
13.1.1 アボット社情報
13.1.2 アボット社の薬物乱用診断キットの製品ポートフォリオおよび仕様
13.1.3 アボット社の薬物乱用診断キットの売上高、収益、価格、粗利益(2020年~2025年
13.1.4 アボットの主な事業概要
13.1.5 アボット社の最新動向
13.2 ロシュ
13.2.1 ロシュ会社情報
13.2.2 ロシュの薬物乱用診断キットの製品ポートフォリオおよび仕様
13.2.3 ロシュの薬物乱用診断キットの売上高、収益、価格、粗利益(2020年~2025年
13.2.4 ロシュの主な事業概要
13.2.5 ロシュの最新動向
13.3 サーモフィッシャーサイエンティフィック
13.3.1 サーモフィッシャーサイエンティフィック会社概要
13.3.2 サーモ・サイエンティフィック 薬物乱用診断キットの製品ポートフォリオと仕様
13.3.3 サーモフィッシャーサイエンティフィック 薬物乱用診断キットの売上高、収益、価格、粗利益率(2020-2025)
13.3.4 サーモフィッシャーサイエンティフィックの主要事業概要
13.3.5 Thermo Scientificの最新動向
13.4 NOVABIOS
13.4.1 NOVABIOS 会社情報
13.4.2 NOVABIOS 薬物乱用診断キットの製品ポートフォリオと仕様
13.4.3 NOVABIOS 薬物乱用診断キットの売上高、収益、価格、粗利益率(2020-2025)
13.4.4 NOVABIOS 主な事業概要
13.4.5 NOVABIOSの最新動向
13.5 AdvaCare Pharma
13.5.1 AdvaCare Pharma 会社概要
13.5.2 AdvaCare Pharma 薬物乱用診断キットの製品ポートフォリオと仕様
13.5.3 AdvaCare Pharma 薬物乱用診断キットの売上高、収益、価格、粗利益率(2020-2025)
13.5.4 AdvaCare Pharma 主な事業概要
13.5.5 AdvaCare Pharma 最新の動向
13.6 アトラス・メディカル
13.6.1 Atlas Medical 会社情報
13.6.2 Atlas Medical 薬物乱用診断キットの製品ポートフォリオと仕様
13.6.3 アトラス・メディカル 薬物乱用診断キットの売上高、収益、価格、粗利益率(2020-2025)
13.6.4 アトラス・メディカル 主な事業概要
13.6.5 アトラス・メディカルの最新動向
13.7 バイオパンダ試薬
13.7.1 バイオパンダ試薬会社情報
13.7.2 Biopanda Reagents 薬物乱用診断キットの製品ポートフォリオと仕様
13.7.3 Biopanda Reagents 薬物乱用診断キットの売上高、収益、価格、粗利益率(2020-2025)
13.7.4 Biopanda Reagents 主な事業概要
13.7.5 Biopanda Reagents 最新の動向
13.8 JALメディカルとJALイノベーション
13.8.1 JALメディカルとJALイノベーションの会社情報
13.8.2 JALメディカルとJALイノベーション 薬物乱用診断キットの製品ポートフォリオと仕様
13.8.3 JALメディカルとJALイノベーション 薬物乱用診断キットの売上高、収益、価格、粗利益率(2020-2025)
13.8.4 JALメディカルとJALイノベーション 主な事業概要
13.8.5 JALメディカルとJALイノベーションの最新動向
13.9 Vitrosens Biotechnology
13.9.1 Vitrosens Biotechnology 会社概要
13.9.2 Vitrosens Biotechnology 薬物乱用診断キットの製品ポートフォリオと仕様
13.9.3 Vitrosens Biotechnology 薬物乱用診断キットの売上高、収益、価格、粗利益率(2020-2025)
13.9.4 Vitrosens Biotechnology 主な事業概要
13.9.5 Vitrosens Biotechnology 最新の動向
13.10 MP Biomedicals
13.10.1 MP Biomedicals 会社概要
13.10.2 MP Biomedicals 薬物乱用診断キットの製品ポートフォリオと仕様
13.10.3 MP Biomedicals 薬物乱用診断キットの売上高、収益、価格、粗利益率(2020-2025)
13.10.4 MP Biomedicals 主な事業概要
13.10.5 MP Biomedicals 最新の動向
13.11 Bioeasy Biotechnology
13.11.1 Bioeasy Biotechnology 会社概要
13.11.2 Bioeasy Biotechnology 薬物乱用診断キットの製品ポートフォリオと仕様
13.11.3 Bioeasy Biotechnology 薬物乱用診断キットの売上高、収益、価格、粗利益率(2020-2025)
13.11.4 Bioeasy Biotechnology 主な事業概要
13.11.5 Bioeasy Biotechnology 最新の動向
13.12 InTec
13.12.1 InTec 会社情報
13.12.2 InTec 薬物乱用診断キットの製品ポートフォリオと仕様
13.12.3 InTec 薬物乱用診断キットの売上高、収益、価格、粗利益率(2020-2025)
13.12.4 InTec 主な事業概要
13.12.5 InTecの最新動向
13.13 廈門ボソンバイオテック
13.13.1 厦門ボソンバイオテック会社情報
13.13.2 廈門ボソンバイオテック 薬物乱用診断キットの製品ポートフォリオと仕様
13.13.3 廈門ボソンバイオテック 薬物乱用診断キットの売上高、収益、価格、粗利益率(2020-2025)
13.13.4 廈門ボソンバイオテック 主な事業概要
13.13.5 廈門ボソンバイオテックの最新動向
13.14 スーパーバイオ・テクノロジー
13.14.1 スーパーバイオ・テクノロジー会社情報
13.14.2 スーパーバイオ・テクノロジー 薬物乱用診断キットの製品ポートフォリオと仕様
13.14.3 スーパーバイオ・テクノロジー 薬物乱用診断キットの売上高、収益、価格、粗利益率(2020-2025)
13.14.4 スーパーバイオ・テクノロジー 主な事業概要
13.14.5 スーパーバイオ・テクノロジーの最新動向
13.15 Biotest Biotech
13.15.1 Biotest Biotech 会社概要
13.15.2 Biotest Biotech 薬物乱用診断キットの製品ポートフォリオと仕様
13.15.3 Biotest Biotech 薬物乱用診断キットの売上高、収益、価格、粗利益率(2020-2025)
13.15.4 Biotest Biotech 主な事業概要
13.15.5 Biotest Biotech 最新の動向
13.16 アールテスト・バイオテック
13.16.1 Alltest Biotech 会社情報
13.16.2 Alltest Biotech 薬物乱用診断キットの製品ポートフォリオと仕様
13.16.3 Alltest Biotech 薬物乱用診断キットの売上高、収益、価格、粗利益率(2020-2025)
13.16.4 Alltest Biotech 主な事業概要
13.16.5 Alltest Biotechの最新動向
13.17 Draeger
13.17.1 Draeger 会社情報
13.17.2 Draeger 薬物乱用診断キットの製品ポートフォリオと仕様
13.17.3 Draeger 薬物乱用診断キットの売上高、収益、価格、粗利益率(2020-2025)
13.17.4 Draeger 主な事業概要
13.17.5 Draegerの最新動向
13.18 オリエント・ジェーン・バイオテック
13.18.1 Orient Gene Biotech 会社情報
13.18.2 オリエント・ジェン・バイオテック 薬物乱用診断キットの製品ポートフォリオと仕様
13.18.3 オリエント・ジェーン・バイオテック 薬物乱用診断キットの売上高、収益、価格、粗利益率(2020-2025)
13.18.4 オリエント・ジェーン・バイオテック 主な事業概要
13.18.5 オリエント・ジェーン・バイオテックの最新動向
14 研究結果と結論
13.18.4 オリエント・ジェーン・バイオテック 主要事業概要
1 Scope of the Report
1.1 Market Introduction
1.2 Years Considered
1.3 Research Objectives
1.4 Market Research Methodology
1.5 Research Process and Data Source
1.6 Economic Indicators
1.7 Currency Considered
1.8 Market Estimation Caveats
2 Executive Summary
2.1 World Market Overview
2.1.1 Global Diagnostic Kit for Drugs of Abuses Annual Sales 2020-2031
2.1.2 World Current & Future Analysis for Diagnostic Kit for Drugs of Abuses by Geographic Region, 2020, 2024 & 2031
2.1.3 World Current & Future Analysis for Diagnostic Kit for Drugs of Abuses by Country/Region, 2020, 2024 & 2031
2.2 Diagnostic Kit for Drugs of Abuses Segment by Type
2.2.1 Urine Test
2.2.2 Saliva Testing
2.2.3 Blood Test
2.3 Diagnostic Kit for Drugs of Abuses Sales by Type
2.3.1 Global Diagnostic Kit for Drugs of Abuses Sales Market Share by Type (2020-2025)
2.3.2 Global Diagnostic Kit for Drugs of Abuses Revenue and Market Share by Type (2020-2025)
2.3.3 Global Diagnostic Kit for Drugs of Abuses Sale Price by Type (2020-2025)
2.4 Diagnostic Kit for Drugs of Abuses Segment by Application
2.4.1 Hospital
2.4.2 Clinic
2.4.3 Household
2.5 Diagnostic Kit for Drugs of Abuses Sales by Application
2.5.1 Global Diagnostic Kit for Drugs of Abuses Sale Market Share by Application (2020-2025)
2.5.2 Global Diagnostic Kit for Drugs of Abuses Revenue and Market Share by Application (2020-2025)
2.5.3 Global Diagnostic Kit for Drugs of Abuses Sale Price by Application (2020-2025)
3 Global by Company
3.1 Global Diagnostic Kit for Drugs of Abuses Breakdown Data by Company
3.1.1 Global Diagnostic Kit for Drugs of Abuses Annual Sales by Company (2020-2025)
3.1.2 Global Diagnostic Kit for Drugs of Abuses Sales Market Share by Company (2020-2025)
3.2 Global Diagnostic Kit for Drugs of Abuses Annual Revenue by Company (2020-2025)
3.2.1 Global Diagnostic Kit for Drugs of Abuses Revenue by Company (2020-2025)
3.2.2 Global Diagnostic Kit for Drugs of Abuses Revenue Market Share by Company (2020-2025)
3.3 Global Diagnostic Kit for Drugs of Abuses Sale Price by Company
3.4 Key Manufacturers Diagnostic Kit for Drugs of Abuses Producing Area Distribution, Sales Area, Product Type
3.4.1 Key Manufacturers Diagnostic Kit for Drugs of Abuses Product Location Distribution
3.4.2 Players Diagnostic Kit for Drugs of Abuses Products Offered
3.5 Market Concentration Rate Analysis
3.5.1 Competition Landscape Analysis
3.5.2 Concentration Ratio (CR3, CR5 and CR10) & (2023-2025)
3.6 New Products and Potential Entrants
3.7 Market M&A Activity & Strategy
4 World Historic Review for Diagnostic Kit for Drugs of Abuses by Geographic Region
4.1 World Historic Diagnostic Kit for Drugs of Abuses Market Size by Geographic Region (2020-2025)
4.1.1 Global Diagnostic Kit for Drugs of Abuses Annual Sales by Geographic Region (2020-2025)
4.1.2 Global Diagnostic Kit for Drugs of Abuses Annual Revenue by Geographic Region (2020-2025)
4.2 World Historic Diagnostic Kit for Drugs of Abuses Market Size by Country/Region (2020-2025)
4.2.1 Global Diagnostic Kit for Drugs of Abuses Annual Sales by Country/Region (2020-2025)
4.2.2 Global Diagnostic Kit for Drugs of Abuses Annual Revenue by Country/Region (2020-2025)
4.3 Americas Diagnostic Kit for Drugs of Abuses Sales Growth
4.4 APAC Diagnostic Kit for Drugs of Abuses Sales Growth
4.5 Europe Diagnostic Kit for Drugs of Abuses Sales Growth
4.6 Middle East & Africa Diagnostic Kit for Drugs of Abuses Sales Growth
5 Americas
5.1 Americas Diagnostic Kit for Drugs of Abuses Sales by Country
5.1.1 Americas Diagnostic Kit for Drugs of Abuses Sales by Country (2020-2025)
5.1.2 Americas Diagnostic Kit for Drugs of Abuses Revenue by Country (2020-2025)
5.2 Americas Diagnostic Kit for Drugs of Abuses Sales by Type (2020-2025)
5.3 Americas Diagnostic Kit for Drugs of Abuses Sales by Application (2020-2025)
5.4 United States
5.5 Canada
5.6 Mexico
5.7 Brazil
6 APAC
6.1 APAC Diagnostic Kit for Drugs of Abuses Sales by Region
6.1.1 APAC Diagnostic Kit for Drugs of Abuses Sales by Region (2020-2025)
6.1.2 APAC Diagnostic Kit for Drugs of Abuses Revenue by Region (2020-2025)
6.2 APAC Diagnostic Kit for Drugs of Abuses Sales by Type (2020-2025)
6.3 APAC Diagnostic Kit for Drugs of Abuses Sales by Application (2020-2025)
6.4 China
6.5 Japan
6.6 South Korea
6.7 Southeast Asia
6.8 India
6.9 Australia
6.10 China Taiwan
7 Europe
7.1 Europe Diagnostic Kit for Drugs of Abuses by Country
7.1.1 Europe Diagnostic Kit for Drugs of Abuses Sales by Country (2020-2025)
7.1.2 Europe Diagnostic Kit for Drugs of Abuses Revenue by Country (2020-2025)
7.2 Europe Diagnostic Kit for Drugs of Abuses Sales by Type (2020-2025)
7.3 Europe Diagnostic Kit for Drugs of Abuses Sales by Application (2020-2025)
7.4 Germany
7.5 France
7.6 UK
7.7 Italy
7.8 Russia
8 Middle East & Africa
8.1 Middle East & Africa Diagnostic Kit for Drugs of Abuses by Country
8.1.1 Middle East & Africa Diagnostic Kit for Drugs of Abuses Sales by Country (2020-2025)
8.1.2 Middle East & Africa Diagnostic Kit for Drugs of Abuses Revenue by Country (2020-2025)
8.2 Middle East & Africa Diagnostic Kit for Drugs of Abuses Sales by Type (2020-2025)
8.3 Middle East & Africa Diagnostic Kit for Drugs of Abuses Sales by Application (2020-2025)
8.4 Egypt
8.5 South Africa
8.6 Israel
8.7 Turkey
8.8 GCC Countries
9 Market Drivers, Challenges and Trends
9.1 Market Drivers & Growth Opportunities
9.2 Market Challenges & Risks
9.3 Industry Trends
10 Manufacturing Cost Structure Analysis
10.1 Raw Material and Suppliers
10.2 Manufacturing Cost Structure Analysis of Diagnostic Kit for Drugs of Abuses
10.3 Manufacturing Process Analysis of Diagnostic Kit for Drugs of Abuses
10.4 Industry Chain Structure of Diagnostic Kit for Drugs of Abuses
11 Marketing, Distributors and Customer
11.1 Sales Channel
11.1.1 Direct Channels
11.1.2 Indirect Channels
11.2 Diagnostic Kit for Drugs of Abuses Distributors
11.3 Diagnostic Kit for Drugs of Abuses Customer
12 World Forecast Review for Diagnostic Kit for Drugs of Abuses by Geographic Region
12.1 Global Diagnostic Kit for Drugs of Abuses Market Size Forecast by Region
12.1.1 Global Diagnostic Kit for Drugs of Abuses Forecast by Region (2026-2031)
12.1.2 Global Diagnostic Kit for Drugs of Abuses Annual Revenue Forecast by Region (2026-2031)
12.2 Americas Forecast by Country (2026-2031)
12.3 APAC Forecast by Region (2026-2031)
12.4 Europe Forecast by Country (2026-2031)
12.5 Middle East & Africa Forecast by Country (2026-2031)
12.6 Global Diagnostic Kit for Drugs of Abuses Forecast by Type (2026-2031)
12.7 Global Diagnostic Kit for Drugs of Abuses Forecast by Application (2026-2031)
13 Key Players Analysis
13.1 Abbott
13.1.1 Abbott Company Information
13.1.2 Abbott Diagnostic Kit for Drugs of Abuses Product Portfolios and Specifications
13.1.3 Abbott Diagnostic Kit for Drugs of Abuses Sales, Revenue, Price and Gross Margin (2020-2025)
13.1.4 Abbott Main Business Overview
13.1.5 Abbott Latest Developments
13.2 Roche
13.2.1 Roche Company Information
13.2.2 Roche Diagnostic Kit for Drugs of Abuses Product Portfolios and Specifications
13.2.3 Roche Diagnostic Kit for Drugs of Abuses Sales, Revenue, Price and Gross Margin (2020-2025)
13.2.4 Roche Main Business Overview
13.2.5 Roche Latest Developments
13.3 Thermo Scientific
13.3.1 Thermo Scientific Company Information
13.3.2 Thermo Scientific Diagnostic Kit for Drugs of Abuses Product Portfolios and Specifications
13.3.3 Thermo Scientific Diagnostic Kit for Drugs of Abuses Sales, Revenue, Price and Gross Margin (2020-2025)
13.3.4 Thermo Scientific Main Business Overview
13.3.5 Thermo Scientific Latest Developments
13.4 NOVABIOS
13.4.1 NOVABIOS Company Information
13.4.2 NOVABIOS Diagnostic Kit for Drugs of Abuses Product Portfolios and Specifications
13.4.3 NOVABIOS Diagnostic Kit for Drugs of Abuses Sales, Revenue, Price and Gross Margin (2020-2025)
13.4.4 NOVABIOS Main Business Overview
13.4.5 NOVABIOS Latest Developments
13.5 AdvaCare Pharma
13.5.1 AdvaCare Pharma Company Information
13.5.2 AdvaCare Pharma Diagnostic Kit for Drugs of Abuses Product Portfolios and Specifications
13.5.3 AdvaCare Pharma Diagnostic Kit for Drugs of Abuses Sales, Revenue, Price and Gross Margin (2020-2025)
13.5.4 AdvaCare Pharma Main Business Overview
13.5.5 AdvaCare Pharma Latest Developments
13.6 Atlas Medical
13.6.1 Atlas Medical Company Information
13.6.2 Atlas Medical Diagnostic Kit for Drugs of Abuses Product Portfolios and Specifications
13.6.3 Atlas Medical Diagnostic Kit for Drugs of Abuses Sales, Revenue, Price and Gross Margin (2020-2025)
13.6.4 Atlas Medical Main Business Overview
13.6.5 Atlas Medical Latest Developments
13.7 Biopanda Reagents
13.7.1 Biopanda Reagents Company Information
13.7.2 Biopanda Reagents Diagnostic Kit for Drugs of Abuses Product Portfolios and Specifications
13.7.3 Biopanda Reagents Diagnostic Kit for Drugs of Abuses Sales, Revenue, Price and Gross Margin (2020-2025)
13.7.4 Biopanda Reagents Main Business Overview
13.7.5 Biopanda Reagents Latest Developments
13.8 JAL Medical and JAL Innovation
13.8.1 JAL Medical and JAL Innovation Company Information
13.8.2 JAL Medical and JAL Innovation Diagnostic Kit for Drugs of Abuses Product Portfolios and Specifications
13.8.3 JAL Medical and JAL Innovation Diagnostic Kit for Drugs of Abuses Sales, Revenue, Price and Gross Margin (2020-2025)
13.8.4 JAL Medical and JAL Innovation Main Business Overview
13.8.5 JAL Medical and JAL Innovation Latest Developments
13.9 Vitrosens Biotechnology
13.9.1 Vitrosens Biotechnology Company Information
13.9.2 Vitrosens Biotechnology Diagnostic Kit for Drugs of Abuses Product Portfolios and Specifications
13.9.3 Vitrosens Biotechnology Diagnostic Kit for Drugs of Abuses Sales, Revenue, Price and Gross Margin (2020-2025)
13.9.4 Vitrosens Biotechnology Main Business Overview
13.9.5 Vitrosens Biotechnology Latest Developments
13.10 MP Biomedicals
13.10.1 MP Biomedicals Company Information
13.10.2 MP Biomedicals Diagnostic Kit for Drugs of Abuses Product Portfolios and Specifications
13.10.3 MP Biomedicals Diagnostic Kit for Drugs of Abuses Sales, Revenue, Price and Gross Margin (2020-2025)
13.10.4 MP Biomedicals Main Business Overview
13.10.5 MP Biomedicals Latest Developments
13.11 Bioeasy Biotechnology
13.11.1 Bioeasy Biotechnology Company Information
13.11.2 Bioeasy Biotechnology Diagnostic Kit for Drugs of Abuses Product Portfolios and Specifications
13.11.3 Bioeasy Biotechnology Diagnostic Kit for Drugs of Abuses Sales, Revenue, Price and Gross Margin (2020-2025)
13.11.4 Bioeasy Biotechnology Main Business Overview
13.11.5 Bioeasy Biotechnology Latest Developments
13.12 InTec
13.12.1 InTec Company Information
13.12.2 InTec Diagnostic Kit for Drugs of Abuses Product Portfolios and Specifications
13.12.3 InTec Diagnostic Kit for Drugs of Abuses Sales, Revenue, Price and Gross Margin (2020-2025)
13.12.4 InTec Main Business Overview
13.12.5 InTec Latest Developments
13.13 Xiamen Boson Biotech
13.13.1 Xiamen Boson Biotech Company Information
13.13.2 Xiamen Boson Biotech Diagnostic Kit for Drugs of Abuses Product Portfolios and Specifications
13.13.3 Xiamen Boson Biotech Diagnostic Kit for Drugs of Abuses Sales, Revenue, Price and Gross Margin (2020-2025)
13.13.4 Xiamen Boson Biotech Main Business Overview
13.13.5 Xiamen Boson Biotech Latest Developments
13.14 Superbio Technology
13.14.1 Superbio Technology Company Information
13.14.2 Superbio Technology Diagnostic Kit for Drugs of Abuses Product Portfolios and Specifications
13.14.3 Superbio Technology Diagnostic Kit for Drugs of Abuses Sales, Revenue, Price and Gross Margin (2020-2025)
13.14.4 Superbio Technology Main Business Overview
13.14.5 Superbio Technology Latest Developments
13.15 Biotest Biotech
13.15.1 Biotest Biotech Company Information
13.15.2 Biotest Biotech Diagnostic Kit for Drugs of Abuses Product Portfolios and Specifications
13.15.3 Biotest Biotech Diagnostic Kit for Drugs of Abuses Sales, Revenue, Price and Gross Margin (2020-2025)
13.15.4 Biotest Biotech Main Business Overview
13.15.5 Biotest Biotech Latest Developments
13.16 Alltest Biotech
13.16.1 Alltest Biotech Company Information
13.16.2 Alltest Biotech Diagnostic Kit for Drugs of Abuses Product Portfolios and Specifications
13.16.3 Alltest Biotech Diagnostic Kit for Drugs of Abuses Sales, Revenue, Price and Gross Margin (2020-2025)
13.16.4 Alltest Biotech Main Business Overview
13.16.5 Alltest Biotech Latest Developments
13.17 Draeger
13.17.1 Draeger Company Information
13.17.2 Draeger Diagnostic Kit for Drugs of Abuses Product Portfolios and Specifications
13.17.3 Draeger Diagnostic Kit for Drugs of Abuses Sales, Revenue, Price and Gross Margin (2020-2025)
13.17.4 Draeger Main Business Overview
13.17.5 Draeger Latest Developments
13.18 Orient Gene Biotech
13.18.1 Orient Gene Biotech Company Information
13.18.2 Orient Gene Biotech Diagnostic Kit for Drugs of Abuses Product Portfolios and Specifications
13.18.3 Orient Gene Biotech Diagnostic Kit for Drugs of Abuses Sales, Revenue, Price and Gross Margin (2020-2025)
13.18.4 Orient Gene Biotech Main Business Overview
13.18.5 Orient Gene Biotech Latest Developments
14 Research Findings and Conclusion
| ※参考情報 乱用薬物用診断キットは、薬物乱用の検査を目的とした医療機器や試薬を指します。これらの診断キットは、血液、尿、 saliva(唾液)、または毛髪など、さまざまな生体試料を用いて、特定の薬物や薬物の代謝産物を検出するために設計されています。このようなキットは、臨床診断、法的な用途、さらには職場や教育機関でのスクリーニングに広く利用されています。 薬物乱用は世界的な問題であり、その影響は個人の健康だけでなく、社会全体に及んでいます。乱用薬物用診断キットは、その迅速さや手軽さから、薬物依存症の早期発見や治療への第一歩として重要な役割を果たしています。また、これらの診断キットは、通常の検査室装置を必要とせず、個人や小規模な診療所でも容易に利用できるため、より多くの人々にアプローチできる利点があります。 この診断キットの特徴の一つとして、試薬の簡便性があります。多くのキットは、結果を数分以内に得ることができるため、検査結果を迅速に知ることができます。また、キットは非侵襲的な方法で検査を行うことができるため、被験者にとっても負担が少なく、使用しやすいと言えます。さらに、これらのキットは、多種類の薬物を同時に検出できるマルチパラメータ型も多く存在し、その柔軟性が評価されています。 種類としては、一般的に以下のように分類されます。尿検査キットは最も普及しており、特に職場でのスクリーニングや医療機関での使用が一般的です。これらのキットは、コカイン、マリファナ、オピオイド、アンフェタミン、バルビツール酸塩など、多様な薬物を検出できます。唾液検査キットは、近年人気が高まっており、使用が簡便で、短時間での結果が得られることからスポーツや運転免許の検査などに利用されています。血液検査キットは、より精度が高いものの、通常は医療従事者が扱うことが必要です。毛髪検査は、長期間の薬物使用の確認に適しており、数ヶ月から数年にわたる使用状況を反映することができます。 用途は多岐にわたります。臨床的な場面では、患者の薬物依存症の診断や治療の経過確認、自宅での自己検査、また治療プログラムのモニタリングに使用されます。その一方で、社会的な側面も大きいです。たとえば、教育機関では学生の薬物乱用を防ぐためのスクリーニングに、職場では従業員の健康管理やリスクマネジメントとして、特に危険職種における検査が行われています。さらに、法的な場面でも、運転免許取得時や犯罪捜査において証拠として使用されることがあります。 関連技術については、主に免疫測定法やクロマトグラフィーが挙げられます。免疫測定法の一つである酵素連結免疫吸着法(ELISA)は、特定の抗体と薬物の結合を利用して定量的に検査を行います。クロマトグラフィーは、より高度な技術で、ガスクロマトグラフィー(GC)や液体クロマトグラフィー(HPLC)などがあり、より微量の薬物を高精度で測定することが可能です。このような技術は、通常は検査室での使用が求められるため、専門的な知識と設備が必要ですが、乱用薬物用診断キットに内蔵される場合もあり、特に精度が求められる場面で利用されます。 乱用薬物用診断キットの普及は、薬物乱用に関する社会的な意識を高め、早期発見や介入を促進する重要な役割を持っています。しかし、その精度や信頼性、法的な妥当性については常に評価される必要があります。たとえば、尿検査は偽陰性や偽陽性のリスクがあり、その結果をどう解釈するかが重要です。したがって、診断キットの結果は、医師や専門家によるさらなる確認と評価が必要です。 最終的に、乱用薬物用診断キットの活用は、薬物依存症の予防や治療、管理において進歩をもたらす方法の一つです。社会的な問題である薬物乱用に対するアプローチの一環として、これらのツールは重要な役割を果たすでしょう。科学技術の進歩とともに、より高精度で使いやすい診断キットが開発されることが期待され、その普及が進むことで、薬物乱用の抑制に寄与することが求められています。 |
❖ 免責事項 ❖
http://www.globalresearch.jp/disclaimer