1 報告の範囲
1.1 市場概要
1.2 対象期間
1.3 研究目的
1.4 市場調査手法
1.5 研究プロセスとデータソース
1.6 経済指標
1.7 対象通貨
1.8 市場推計の留意点
2 執行要約
2.1 世界市場の概要
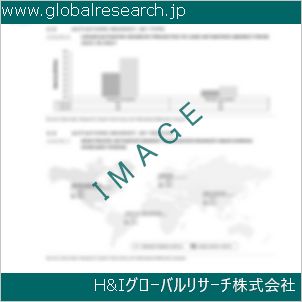
2.1.1 2020年から2031年までの世界麻酔装置の年間販売額
2.1.2 地域別麻酔装置の現在の状況と将来予測(2020年、2024年、2031年)
2.1.3 地域別麻酔装置の市場動向(2020年、2024年、2031年)
2.2 麻酔装置のセグメント別分析(タイプ別)
2.2.1 固定式
2.2.2 移動式
2.3 麻酔装置の売上高(タイプ別)
2.3.1 グローバル麻酔装置販売市場シェア(タイプ別)(2020-2025)
2.3.2 グローバル麻酔装置の売上高と市場シェア(種類別)(2020-2025)
2.3.3 グローバル麻酔装置の販売価格(種類別)(2020-2025)
2.4 麻酔装置の用途別セグメント
2.4.1 病院
2.4.2 クリニック
2.4.3 外来手術センター
2.4.4 その他
2.5 麻酔装置の売上高(用途別)
2.5.1 用途別麻酔装置販売市場シェア(2020-2025)
2.5.2 用途別麻酔装置の売上高と市場シェア(2020-2025)
2.5.3 用途別麻酔装置販売価格(2020-2025)
3 グローバル企業別
3.1 グローバル麻酔装置の企業別内訳データ
3.1.1 グローバル麻酔装置の年間販売額(企業別)(2020-2025)
3.1.2 グローバル麻酔装置の売上高市場シェア(企業別)(2020-2025)
3.2 グローバル麻酔装置の年間売上高(企業別)(2020-2025)
3.2.1 グローバル麻酔装置の企業別売上高(2020-2025)
3.2.2 グローバル麻酔装置売上高市場シェア(企業別)(2020-2025)
3.3 グローバル麻酔装置の企業別販売価格
3.4 主要メーカーの麻酔装置の製造地域分布、販売地域、製品タイプ
3.4.1 主要メーカーの麻酔装置製品所在地分布
3.4.2 主要メーカーが提供する麻酔装置製品
3.5 市場集中率分析
3.5.1 競争環境分析
3.5.2 集中率(CR3、CR5、CR10)および(2023-2025)
3.6 新製品と潜在的な新規参入企業
3.7 市場M&A活動と戦略
4 地域別麻酔装置の世界歴史的動向
4.1 世界麻酔装置市場規模(地域別)(2020-2025)
4.1.1 地域別麻酔装置の年間売上高(2020-2025)
4.1.2 地域別麻酔装置の年間売上高(2020-2025)
4.2 世界麻酔装置市場規模(地域別/国別)(2020-2025)
4.2.1 グローバル麻酔装置の年間販売額(地域別)(2020-2025)
4.2.2 地域別麻酔装置の年間売上高(2020-2025)
4.3 アメリカズ麻酔装置の販売成長率
4.4 アジア太平洋地域麻酔装置販売成長率
4.5 欧州の麻酔装置販売成長率
4.6 中東・アフリカ地域 麻酔装置の販売成長率
5 アメリカ
5.1 アメリカ大陸の麻酔装置販売額(国別)
5.1.1 アメリカズ麻酔装置販売額(国別)(2020-2025)
5.1.2 アメリカ大陸の麻酔装置売上高(国別)(2020-2025)
5.2 アメリカ大陸の麻酔装置販売額(種類別)(2020-2025)
5.3 アメリカズ 麻酔装置の販売額(用途別)(2020-2025)
5.4 アメリカ合衆国
5.5 カナダ
5.6 メキシコ
5.7 ブラジル
6 アジア太平洋地域
6.1 APAC地域別麻酔装置販売額
6.1.1 APAC地域別麻酔装置販売額(2020-2025)
6.1.2 アジア太平洋地域(APAC)麻酔装置の売上高(地域別)(2020-2025)
6.2 アジア太平洋地域(APAC)の麻酔装置販売量(2020-2025年)
6.3 アジア太平洋地域(APAC)の麻酔装置販売額(2020-2025)
6.4 中国
6.5 日本
6.6 韓国
6.7 東南アジア
6.8 インド
6.9 オーストラリア
6.10 中国・台湾
7 ヨーロッパ
7.1 欧州の麻酔装置の市場規模(国別)
7.1.1 欧州麻酔装置の売上高(国別)(2020-2025)
7.1.2 欧州麻酔装置の売上高(国別)(2020-2025)
7.2 欧州麻酔装置の売上高(種類別)(2020-2025)
7.3 欧州麻酔装置の売上高(用途別)(2020-2025)
7.4 ドイツ
7.5 フランス
7.6 イギリス
7.7 イタリア
7.8 ロシア
8 中東・アフリカ
8.1 中東・アフリカ地域 麻酔装置の市場規模(国別)
8.1.1 中東・アフリカ地域麻酔装置の売上高(国別)(2020-2025)
8.1.2 中東・アフリカ地域麻酔装置の売上高(国別)(2020-2025)
8.2 中東・アフリカ地域 麻酔装置の売上高(2020-2025年)
8.3 中東・アフリカ地域における麻酔装置の販売額(2020-2025年)
8.4 エジプト
8.5 南アフリカ
8.6 イスラエル
8.7 トルコ
8.8 GCC諸国
9 市場動向、課題、およびトレンド
9.1 市場ドライバーと成長機会
9.2 市場課題とリスク
9.3 業界の動向
10 製造コスト構造分析
10.1 原材料とサプライヤー
10.2 麻酔装置の製造コスト構造分析
10.3 麻酔装置の製造プロセス分析
10.4 麻酔装置の産業チェーン構造
11 マーケティング、販売代理店および顧客
11.1 販売チャネル
11.1.1 直接チャネル
11.1.2 間接チャネル
11.2 麻酔装置の卸売業者
11.3 麻酔装置の顧客
12 地域別麻酔装置の世界市場予測レビュー
12.1 地域別麻酔装置市場規模予測
12.1.1 地域別麻酔装置市場予測(2026-2031)
12.1.2 地域別麻酔装置年間売上高予測(2026-2031)
12.2 アメリカ地域別予測(2026-2031)
12.3 アジア太平洋地域別予測(2026-2031)
12.4 欧州地域別予測(2026-2031)
12.5 中東・アフリカ地域別予測(2026-2031年)
12.6 グローバル麻酔装置市場予測(タイプ別)(2026-2031)
12.7 グローバル麻酔装置市場予測(用途別)(2026-2031)
13 主要企業分析
13.1 ジョンソン・アンド・ジョンソン
13.1.1 ジョンソン・アンド・ジョンソン企業情報
13.1.2 ジョンソン・アンド・ジョンソン 麻酔装置の製品ポートフォリオと仕様
13.1.3 ジョンソン・エンド・ジョンソン 麻酔装置の売上高、収益、価格、粗利益率(2020-2025)
13.1.4 ジョンソン・エンド・ジョンソンの主要事業概要
13.1.5 ジョンソン・エンド・ジョンソンの最新動向
13.2 メドトロニック
13.2.1 メドトロニック企業情報
13.2.2 メドトロニック麻酔装置製品ポートフォリオと仕様
13.2.3 メドトロニックの麻酔装置の売上高、収益、価格、粗利益率(2020-2025)
13.2.4 メドトロニックの主要事業概要
13.2.5 メドトロニックの最新動向
13.3 フィリップス
13.3.1 フィリップス企業情報
13.3.2 フィリップス麻酔装置の製品ポートフォリオと仕様
13.3.3 フィリップス麻酔装置の売上高、収益、価格、粗利益率(2020-2025)
13.3.4 フィリップスの主要事業概要
13.3.5 フィリップスの最新動向
13.4 PPD
13.4.1 PPD 会社情報
13.4.2 PPD 麻酔装置の製品ポートフォリオと仕様
13.4.3 PPD 麻酔装置の売上高、収益、価格、粗利益率(2020-2025)
13.4.4 PPD 主な事業概要
13.4.5 PPDの最新動向
13.5 大日本住友製薬株式会社
13.5.1 大日本住友製薬株式会社 会社概要
13.5.2 大日本住友製薬株式会社 麻酔装置製品ポートフォリオと仕様
13.5.3 大日本住友製薬株式会社 麻酔装置の売上高、収益、価格、粗利益率(2020-2025)
13.5.4 大日本住友製薬株式会社 主な事業概要
13.5.5 第一三共株式会社の最新動向
13.6 アボット・ラボラトリーズ
13.6.1 アボット・ラボラトリーズ 会社情報
13.6.2 アボット・ラボラトリーズの麻酔装置製品ポートフォリオおよび仕様
13.6.3 アボット・ラボラトリーズの麻酔装置の売上高、収益、価格、粗利益(2020年~2025年
13.6.4 アボット・ラボラトリーズの主な事業概要
13.6.5 アボット・ラボラトリーズの最新動向
13.7 アボット
13.7.1 アボット社情報
13.7.2 アボット麻酔装置製品ポートフォリオおよび仕様
13.7.3 アボット麻酔装置の売上高、収益、価格、粗利益(2020年~2025年
13.7.4 アボット社の主な事業概要
13.7.5 アボット社の最新動向
13.8 シーメンス
13.8.1 シーメンス会社情報
13.8.2 シーメンスの麻酔装置製品ポートフォリオおよび仕様
13.8.3 シーメンスの麻酔装置の販売、収益、価格、粗利益(2020年~2025年
13.8.4 シーメンスの主な事業概要
13.8.5 シエメンスの最新動向
13.9 GEヘルスケア
13.9.1 GE Healthcare 会社概要
13.9.2 GEヘルスケア 麻酔装置の製品ポートフォリオと仕様
13.9.3 GE Healthcare 麻酔装置の売上高、収益、価格、粗利益率(2020-2025)
13.9.4 GE Healthcare 主な事業概要
13.9.5 GE Healthcareの最新動向
13.10 カメロン・ヘルス
13.10.1 Cameron Health 会社情報
13.10.2 カメロン・ヘルス麻酔装置製品ポートフォリオと仕様
13.10.3 カメロン・ヘルス麻酔装置の売上高、収益、価格、粗利益率(2020-2025)
13.10.4 Cameron Health 主な事業概要
13.10.5 カメロン・ヘルス 最新動向
13.11 カーディナル・ヘルス、オハイオ州コロンバス
13.11.1 カーディナル・ヘルス、オハイオ州コロンバス 会社情報
13.11.2 カーディナル・ヘルス、オハイオ州コロンバス 麻酔装置製品ポートフォリオと仕様
13.11.3 カーディナル・ヘルス、オハイオ州コロンバス 麻酔装置の売上高、収益、価格、粗利益率(2020-2025)
13.11.4 カーディナル・ヘルス、オハイオ州コロンバス 主要事業概要
13.11.5 カーディナル・ヘルス、オハイオ州コロンバス 最新動向
13.12 ボストン・サイエンティフィック
13.12.1 ボストン・サイエンティフィック 会社概要
13.12.2 ボストン・サイエンティフィック 麻酔装置製品ポートフォリオと仕様
13.12.3 ボストン・サイエンティフィック 麻酔装置の売上高、収益、価格、粗利益率(2020-2025)
13.12.4 ボストン・サイエンティフィック 主な事業概要
13.12.5 ボストン・サイエンティフィックの最新動向
13.13 ベックマン・コールター
13.13.1 ベックマン・コールター会社概要
13.13.2 ベックマン・コールター 麻酔装置の製品ポートフォリオと仕様
13.13.3 ベックマン・コールター麻酔装置の売上高、収益、価格、粗利益率(2020-2025)
13.13.4 ベックマン・コールター 主な事業概要
13.13.5 ベックマン・コールター 最新動向
13.14 ドラエガー
13.14.1 ドラエガー会社情報
13.14.2 ドラエガー麻酔装置の製品ポートフォリオと仕様
13.14.3 ドラエガー麻酔装置の売上高、収益、価格、粗利益率(2020-2025)
13.14.4 ドラエガーの主要事業概要
13.14.5 Draegerの最新動向
13.15 ゲティンゲ・グループ
13.15.1 ゲティンゲ・グループ企業情報
13.15.2 ゲティンゲ・グループ 麻酔装置製品ポートフォリオと仕様
13.15.3 ゲティンゲ・グループ 麻酔装置の売上高、収益、価格、粗利益率(2020-2025)
13.15.4 ゲティンゲ・グループ 主要事業概要
13.15.5 ゲティンゲ・グループ 最新動向
13.16 Heine Optotechnik
13.16.1 Heine Optotechnik 会社概要
13.16.2 Heine Optotechnik 麻酔装置の製品ポートフォリオと仕様
13.16.3 Heine Optotechnik 麻酔装置の売上高、収益、価格、粗利益率(2020-2025)
13.16.4 Heine Optotechnik 主な事業概要
13.16.5 ヘイン・オプトテクニクの最新動向
13.17 ヘンリー・シェイン
13.17.1 ヘンリー・シェイン 会社概要
13.17.2 ヘンリー・シェイン 麻酔装置製品ポートフォリオと仕様
13.17.3 ヘンリー・シェイン 麻酔装置の売上高、収益、価格、粗利益率(2020-2025)
13.17.4 ヘンリー・シェイン 主な事業概要
13.17.5 ヘンリー・シェインの最新動向
13.18 マケット
13.18.1 マケット会社情報
13.18.2 マケット麻酔装置製品ポートフォリオと仕様
13.18.3 マケット麻酔装置の売上高、収益、価格、粗利益率(2020-2025)
13.18.4 マケット主要事業概要
13.18.5 Maquetの最新動向
13.19 REXMED
13.19.1 REXMED 会社情報
13.19.2 REXMED 麻酔装置の製品ポートフォリオと仕様
13.19.3 REXMED 麻酔装置の売上高、収益、価格、粗利益率(2020-2025)
13.19.4 REXMED 主な事業概要
13.19.5 REXMED 最新の動向
13.20 Mileston
13.20.1 Mileston 会社情報
13.20.2 Mileston 麻酔装置製品ポートフォリオと仕様
13.20.3 Mileston 麻酔装置の売上高、収益、価格、および粗利益率(2020-2025)
13.20.4 Mileston 主な事業概要
13.20.5 ミレストンの最新動向
14 研究結果と結論
13.20.4 ミレストン麻酔装置製品ポートフォリオと仕様
1 Scope of the Report
1.1 Market Introduction
1.2 Years Considered
1.3 Research Objectives
1.4 Market Research Methodology
1.5 Research Process and Data Source
1.6 Economic Indicators
1.7 Currency Considered
1.8 Market Estimation Caveats
2 Executive Summary
2.1 World Market Overview
2.1.1 Global Anaesthetic Apparatus Annual Sales 2020-2031
2.1.2 World Current & Future Analysis for Anaesthetic Apparatus by Geographic Region, 2020, 2024 & 2031
2.1.3 World Current & Future Analysis for Anaesthetic Apparatus by Country/Region, 2020, 2024 & 2031
2.2 Anaesthetic Apparatus Segment by Type
2.2.1 Fixed
2.2.2 Mobile
2.3 Anaesthetic Apparatus Sales by Type
2.3.1 Global Anaesthetic Apparatus Sales Market Share by Type (2020-2025)
2.3.2 Global Anaesthetic Apparatus Revenue and Market Share by Type (2020-2025)
2.3.3 Global Anaesthetic Apparatus Sale Price by Type (2020-2025)
2.4 Anaesthetic Apparatus Segment by Application
2.4.1 Hospitals
2.4.2 Clinics
2.4.3 Ambulatory Surgical Centers
2.4.4 Other
2.5 Anaesthetic Apparatus Sales by Application
2.5.1 Global Anaesthetic Apparatus Sale Market Share by Application (2020-2025)
2.5.2 Global Anaesthetic Apparatus Revenue and Market Share by Application (2020-2025)
2.5.3 Global Anaesthetic Apparatus Sale Price by Application (2020-2025)
3 Global by Company
3.1 Global Anaesthetic Apparatus Breakdown Data by Company
3.1.1 Global Anaesthetic Apparatus Annual Sales by Company (2020-2025)
3.1.2 Global Anaesthetic Apparatus Sales Market Share by Company (2020-2025)
3.2 Global Anaesthetic Apparatus Annual Revenue by Company (2020-2025)
3.2.1 Global Anaesthetic Apparatus Revenue by Company (2020-2025)
3.2.2 Global Anaesthetic Apparatus Revenue Market Share by Company (2020-2025)
3.3 Global Anaesthetic Apparatus Sale Price by Company
3.4 Key Manufacturers Anaesthetic Apparatus Producing Area Distribution, Sales Area, Product Type
3.4.1 Key Manufacturers Anaesthetic Apparatus Product Location Distribution
3.4.2 Players Anaesthetic Apparatus Products Offered
3.5 Market Concentration Rate Analysis
3.5.1 Competition Landscape Analysis
3.5.2 Concentration Ratio (CR3, CR5 and CR10) & (2023-2025)
3.6 New Products and Potential Entrants
3.7 Market M&A Activity & Strategy
4 World Historic Review for Anaesthetic Apparatus by Geographic Region
4.1 World Historic Anaesthetic Apparatus Market Size by Geographic Region (2020-2025)
4.1.1 Global Anaesthetic Apparatus Annual Sales by Geographic Region (2020-2025)
4.1.2 Global Anaesthetic Apparatus Annual Revenue by Geographic Region (2020-2025)
4.2 World Historic Anaesthetic Apparatus Market Size by Country/Region (2020-2025)
4.2.1 Global Anaesthetic Apparatus Annual Sales by Country/Region (2020-2025)
4.2.2 Global Anaesthetic Apparatus Annual Revenue by Country/Region (2020-2025)
4.3 Americas Anaesthetic Apparatus Sales Growth
4.4 APAC Anaesthetic Apparatus Sales Growth
4.5 Europe Anaesthetic Apparatus Sales Growth
4.6 Middle East & Africa Anaesthetic Apparatus Sales Growth
5 Americas
5.1 Americas Anaesthetic Apparatus Sales by Country
5.1.1 Americas Anaesthetic Apparatus Sales by Country (2020-2025)
5.1.2 Americas Anaesthetic Apparatus Revenue by Country (2020-2025)
5.2 Americas Anaesthetic Apparatus Sales by Type (2020-2025)
5.3 Americas Anaesthetic Apparatus Sales by Application (2020-2025)
5.4 United States
5.5 Canada
5.6 Mexico
5.7 Brazil
6 APAC
6.1 APAC Anaesthetic Apparatus Sales by Region
6.1.1 APAC Anaesthetic Apparatus Sales by Region (2020-2025)
6.1.2 APAC Anaesthetic Apparatus Revenue by Region (2020-2025)
6.2 APAC Anaesthetic Apparatus Sales by Type (2020-2025)
6.3 APAC Anaesthetic Apparatus Sales by Application (2020-2025)
6.4 China
6.5 Japan
6.6 South Korea
6.7 Southeast Asia
6.8 India
6.9 Australia
6.10 China Taiwan
7 Europe
7.1 Europe Anaesthetic Apparatus by Country
7.1.1 Europe Anaesthetic Apparatus Sales by Country (2020-2025)
7.1.2 Europe Anaesthetic Apparatus Revenue by Country (2020-2025)
7.2 Europe Anaesthetic Apparatus Sales by Type (2020-2025)
7.3 Europe Anaesthetic Apparatus Sales by Application (2020-2025)
7.4 Germany
7.5 France
7.6 UK
7.7 Italy
7.8 Russia
8 Middle East & Africa
8.1 Middle East & Africa Anaesthetic Apparatus by Country
8.1.1 Middle East & Africa Anaesthetic Apparatus Sales by Country (2020-2025)
8.1.2 Middle East & Africa Anaesthetic Apparatus Revenue by Country (2020-2025)
8.2 Middle East & Africa Anaesthetic Apparatus Sales by Type (2020-2025)
8.3 Middle East & Africa Anaesthetic Apparatus Sales by Application (2020-2025)
8.4 Egypt
8.5 South Africa
8.6 Israel
8.7 Turkey
8.8 GCC Countries
9 Market Drivers, Challenges and Trends
9.1 Market Drivers & Growth Opportunities
9.2 Market Challenges & Risks
9.3 Industry Trends
10 Manufacturing Cost Structure Analysis
10.1 Raw Material and Suppliers
10.2 Manufacturing Cost Structure Analysis of Anaesthetic Apparatus
10.3 Manufacturing Process Analysis of Anaesthetic Apparatus
10.4 Industry Chain Structure of Anaesthetic Apparatus
11 Marketing, Distributors and Customer
11.1 Sales Channel
11.1.1 Direct Channels
11.1.2 Indirect Channels
11.2 Anaesthetic Apparatus Distributors
11.3 Anaesthetic Apparatus Customer
12 World Forecast Review for Anaesthetic Apparatus by Geographic Region
12.1 Global Anaesthetic Apparatus Market Size Forecast by Region
12.1.1 Global Anaesthetic Apparatus Forecast by Region (2026-2031)
12.1.2 Global Anaesthetic Apparatus Annual Revenue Forecast by Region (2026-2031)
12.2 Americas Forecast by Country (2026-2031)
12.3 APAC Forecast by Region (2026-2031)
12.4 Europe Forecast by Country (2026-2031)
12.5 Middle East & Africa Forecast by Country (2026-2031)
12.6 Global Anaesthetic Apparatus Forecast by Type (2026-2031)
12.7 Global Anaesthetic Apparatus Forecast by Application (2026-2031)
13 Key Players Analysis
13.1 Johnson & Johnson
13.1.1 Johnson & Johnson Company Information
13.1.2 Johnson & Johnson Anaesthetic Apparatus Product Portfolios and Specifications
13.1.3 Johnson & Johnson Anaesthetic Apparatus Sales, Revenue, Price and Gross Margin (2020-2025)
13.1.4 Johnson & Johnson Main Business Overview
13.1.5 Johnson & Johnson Latest Developments
13.2 Medtronic
13.2.1 Medtronic Company Information
13.2.2 Medtronic Anaesthetic Apparatus Product Portfolios and Specifications
13.2.3 Medtronic Anaesthetic Apparatus Sales, Revenue, Price and Gross Margin (2020-2025)
13.2.4 Medtronic Main Business Overview
13.2.5 Medtronic Latest Developments
13.3 Philips
13.3.1 Philips Company Information
13.3.2 Philips Anaesthetic Apparatus Product Portfolios and Specifications
13.3.3 Philips Anaesthetic Apparatus Sales, Revenue, Price and Gross Margin (2020-2025)
13.3.4 Philips Main Business Overview
13.3.5 Philips Latest Developments
13.4 PPD
13.4.1 PPD Company Information
13.4.2 PPD Anaesthetic Apparatus Product Portfolios and Specifications
13.4.3 PPD Anaesthetic Apparatus Sales, Revenue, Price and Gross Margin (2020-2025)
13.4.4 PPD Main Business Overview
13.4.5 PPD Latest Developments
13.5 Daiichi Sankyo Company Limited
13.5.1 Daiichi Sankyo Company Limited Company Information
13.5.2 Daiichi Sankyo Company Limited Anaesthetic Apparatus Product Portfolios and Specifications
13.5.3 Daiichi Sankyo Company Limited Anaesthetic Apparatus Sales, Revenue, Price and Gross Margin (2020-2025)
13.5.4 Daiichi Sankyo Company Limited Main Business Overview
13.5.5 Daiichi Sankyo Company Limited Latest Developments
13.6 Abbott Laboratories
13.6.1 Abbott Laboratories Company Information
13.6.2 Abbott Laboratories Anaesthetic Apparatus Product Portfolios and Specifications
13.6.3 Abbott Laboratories Anaesthetic Apparatus Sales, Revenue, Price and Gross Margin (2020-2025)
13.6.4 Abbott Laboratories Main Business Overview
13.6.5 Abbott Laboratories Latest Developments
13.7 Abbott
13.7.1 Abbott Company Information
13.7.2 Abbott Anaesthetic Apparatus Product Portfolios and Specifications
13.7.3 Abbott Anaesthetic Apparatus Sales, Revenue, Price and Gross Margin (2020-2025)
13.7.4 Abbott Main Business Overview
13.7.5 Abbott Latest Developments
13.8 Siemens
13.8.1 Siemens Company Information
13.8.2 Siemens Anaesthetic Apparatus Product Portfolios and Specifications
13.8.3 Siemens Anaesthetic Apparatus Sales, Revenue, Price and Gross Margin (2020-2025)
13.8.4 Siemens Main Business Overview
13.8.5 Siemens Latest Developments
13.9 GE Healthcare
13.9.1 GE Healthcare Company Information
13.9.2 GE Healthcare Anaesthetic Apparatus Product Portfolios and Specifications
13.9.3 GE Healthcare Anaesthetic Apparatus Sales, Revenue, Price and Gross Margin (2020-2025)
13.9.4 GE Healthcare Main Business Overview
13.9.5 GE Healthcare Latest Developments
13.10 Cameron Health
13.10.1 Cameron Health Company Information
13.10.2 Cameron Health Anaesthetic Apparatus Product Portfolios and Specifications
13.10.3 Cameron Health Anaesthetic Apparatus Sales, Revenue, Price and Gross Margin (2020-2025)
13.10.4 Cameron Health Main Business Overview
13.10.5 Cameron Health Latest Developments
13.11 Cardinal Health, Columbus, Ohio
13.11.1 Cardinal Health, Columbus, Ohio Company Information
13.11.2 Cardinal Health, Columbus, Ohio Anaesthetic Apparatus Product Portfolios and Specifications
13.11.3 Cardinal Health, Columbus, Ohio Anaesthetic Apparatus Sales, Revenue, Price and Gross Margin (2020-2025)
13.11.4 Cardinal Health, Columbus, Ohio Main Business Overview
13.11.5 Cardinal Health, Columbus, Ohio Latest Developments
13.12 Boston Scientific
13.12.1 Boston Scientific Company Information
13.12.2 Boston Scientific Anaesthetic Apparatus Product Portfolios and Specifications
13.12.3 Boston Scientific Anaesthetic Apparatus Sales, Revenue, Price and Gross Margin (2020-2025)
13.12.4 Boston Scientific Main Business Overview
13.12.5 Boston Scientific Latest Developments
13.13 Beckman Coulter
13.13.1 Beckman Coulter Company Information
13.13.2 Beckman Coulter Anaesthetic Apparatus Product Portfolios and Specifications
13.13.3 Beckman Coulter Anaesthetic Apparatus Sales, Revenue, Price and Gross Margin (2020-2025)
13.13.4 Beckman Coulter Main Business Overview
13.13.5 Beckman Coulter Latest Developments
13.14 Draeger
13.14.1 Draeger Company Information
13.14.2 Draeger Anaesthetic Apparatus Product Portfolios and Specifications
13.14.3 Draeger Anaesthetic Apparatus Sales, Revenue, Price and Gross Margin (2020-2025)
13.14.4 Draeger Main Business Overview
13.14.5 Draeger Latest Developments
13.15 Getinge Group
13.15.1 Getinge Group Company Information
13.15.2 Getinge Group Anaesthetic Apparatus Product Portfolios and Specifications
13.15.3 Getinge Group Anaesthetic Apparatus Sales, Revenue, Price and Gross Margin (2020-2025)
13.15.4 Getinge Group Main Business Overview
13.15.5 Getinge Group Latest Developments
13.16 Heine Optotechnik
13.16.1 Heine Optotechnik Company Information
13.16.2 Heine Optotechnik Anaesthetic Apparatus Product Portfolios and Specifications
13.16.3 Heine Optotechnik Anaesthetic Apparatus Sales, Revenue, Price and Gross Margin (2020-2025)
13.16.4 Heine Optotechnik Main Business Overview
13.16.5 Heine Optotechnik Latest Developments
13.17 Henry Schein
13.17.1 Henry Schein Company Information
13.17.2 Henry Schein Anaesthetic Apparatus Product Portfolios and Specifications
13.17.3 Henry Schein Anaesthetic Apparatus Sales, Revenue, Price and Gross Margin (2020-2025)
13.17.4 Henry Schein Main Business Overview
13.17.5 Henry Schein Latest Developments
13.18 Maquet
13.18.1 Maquet Company Information
13.18.2 Maquet Anaesthetic Apparatus Product Portfolios and Specifications
13.18.3 Maquet Anaesthetic Apparatus Sales, Revenue, Price and Gross Margin (2020-2025)
13.18.4 Maquet Main Business Overview
13.18.5 Maquet Latest Developments
13.19 REXMED
13.19.1 REXMED Company Information
13.19.2 REXMED Anaesthetic Apparatus Product Portfolios and Specifications
13.19.3 REXMED Anaesthetic Apparatus Sales, Revenue, Price and Gross Margin (2020-2025)
13.19.4 REXMED Main Business Overview
13.19.5 REXMED Latest Developments
13.20 Mileston
13.20.1 Mileston Company Information
13.20.2 Mileston Anaesthetic Apparatus Product Portfolios and Specifications
13.20.3 Mileston Anaesthetic Apparatus Sales, Revenue, Price and Gross Margin (2020-2025)
13.20.4 Mileston Main Business Overview
13.20.5 Mileston Latest Developments
14 Research Findings and Conclusion
| ※参考情報 麻酔器具は、手術や診療時に患者に麻酔を施すために使用される医療機器です。これらの器具は、適切な麻酔の管理と投与を可能にし、患者の安全と快適さを確保する役割を果たしています。現代の麻酔の技術と方法は多岐にわたり、様々な麻酔器具が開発されています。以下に、麻酔器具の定義、特徴、種類、用途、関連技術について詳しく説明いたします。 麻酔器具の定義についてですが、麻酔器具は主に全身麻酔や局所麻酔を施すために使用される装置や器具の総称です。これには、麻酔薬を投与するための機器、患者の呼吸を管理する装置、生命兆候を監視するための機器などが含まれます。また、麻酔器具は、医療現場で安全に麻酔を行うために必要な様々な要素を融合させています。麻酔は、手術や処置中に患者が痛みを感じることを防ぎ、意識を失わせることによって、医療行為を円滑に進めるために重要な役割を果たします。 麻酔器具の特徴としては、まず、安全性が挙げられます。麻酔は、患者の生命に直接かかわるため、器具は厳格に設計され、試験されており、高い安全基準を満たす必要があります。次に、信頼性も大切です。麻酔中に器具が故障することがないよう、故障モードやリスクを考慮した設計が求められます。操作性についても、医療スタッフが容易に扱えるように ergonomics(人間工学)に基づいた設計が重視されています。さらに、最新技術を取り入れ、常に進化する麻酔器具も多く、リアルタイムでのデータ処理や監視機能を備えたものも存在します。 麻酔器具の種類については、主に全身麻酔器、局所麻酔器、吸入麻酔器、注射器、オキシゲン供給装置などがあります。全身麻酔器は、全身麻酔薬を投与し、維持するための装置です。麻酔薬の投与と同時に、患者の呼吸を保つためのガス流量を調整します。局所麻酔器は、特定の部位に麻酔を施すための器具で、通常は注射器や局所麻酔薬の供給装置が含まれます。 吸入麻酔器は、揮発性麻酔薬を気体状で患者に投与するための器具です。酸素や麻酔薬の混合気体を患者に供給し、その濃度を調整する機能を持っています。注射器は、麻酔薬を直接静脈や筋肉内に投与するために用います。オキシゲン供給装置は、麻酔中の患者の呼吸をサポートするための機器で、酸素を供給し、二酸化炭素の排出を促します。 麻酔器具の用途は、手術室だけでなく、救急医療や診療所、歯科医院など多様な医療環境に広がっています。手術室では、麻酔の提供と患者の監視が行われるため、より高機能な器具が使用されます。救急医療では、迅速な対応が求められるため、 portable(携帯型)の麻酔器具が重要です。歯科医院では、日常的に局所麻酔が行われるため、簡便で効率的な器具が必要とされています。 関連技術としては、麻酔におけるモニタリング技術が重要です。これは、患者の生理的状態、心拍数、血圧、酸素飽和度などをリアルタイムで監視するための装置やシステムを指します。これにより、麻酔医は患者の状態を把握し、麻酔の深さや薬剤の投与量を適切に調整することが可能になります。また、デジタル技術の進展により、データ蓄積の解析やAI(人工知能)を活用した予測モデルの実装が進んでおり、麻酔の安全性が一層向上しています。 さらに、麻酔器具の設計においては、環境への配慮も重要な要素です。麻酔に使用するガスの排出による環境影響を最小限に抑えるための技術、再利用可能な器具の開発などが進められています。省エネルギーや持続可能な資源の利用も、現代の麻酔器具の設計において考慮される重要なポイントです。 次に、麻酔器具の進化についても触れておきます。テクノロジーの進展に伴い、麻酔器具はますます高性能化し、コンパクト化しています。例えば、電子的なコントロールシステムや、より直感的なユーザーインターフェースを持つ器具が登場しています。これにより、医療スタッフはより簡単に麻酔の管理や調整が可能となり、患者の安全性が高まります。 以上のように、麻酔器具は医療現場で不可欠な要素であり、その安全性、信頼性、最新技術への対応が求められています。さまざまな種類の器具が存在し、各々が異なる用途に適しており、それぞれが独自の役割を果たしています。麻酔器具の進化とともに、患者へ提供する医療の質も向上し、今後もさらなる革新が期待される分野と言えるでしょう。患者の様々なニーズに応えるために、麻酔器具は今後も進化し続けていくと考えられます。 |
❖ 免責事項 ❖
http://www.globalresearch.jp/disclaimer